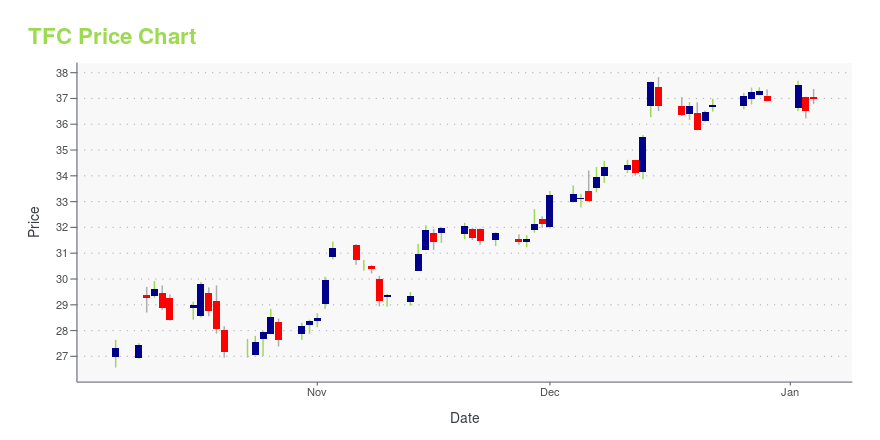
Truist Financial Corp. (TFC): Price and Financial Metrics
TFC Price/Volume Stats
| Current price | $40.28 | 52-week high | $49.06 |
| Prev. close | $39.81 | 52-week low | $33.56 |
| Day low | $39.94 | Volume | 10,243,000 |
| Day high | $40.31 | Avg. volume | 8,904,468 |
| 50-day MA | $38.99 | Dividend yield | 5.16% |
| 200-day MA | $42.75 | Market Cap | 52.75B |
TFC Stock Price Chart Interactive Chart >
Truist Financial Corp. (TFC) Company Bio
Truist Financial Corporation is an American bank holding company headquartered in Charlotte, North Carolina. The company was formed in December 2019 as the result of the merger of BB&T (Branch Banking and Trust Company) and SunTrust Banks. Its bank operates 2,781 branches in 15 states and Washington, D.C., and offers consumer and commercial banking, securities brokerage, asset management, mortgage, and insurance products and services. It is on the list of largest banks in the United States by assets, as of June 2021 it is the 10th largest bank with $509 billion in assets. As of January 2021 Truist Insurance Holdings is the 7th largest insurance broker in the world with $2.27 billion in annual revenue. (Source:Wikipedia)
TFC Price Returns
| 1-mo | 2.55% |
| 3-mo | -2.82% |
| 6-mo | N/A |
| 1-year | 14.90% |
| 3-year | -3.82% |
| 5-year | 34.76% |
| YTD | -4.84% |
| 2024 | 23.72% |
| 2023 | -8.59% |
| 2022 | -23.53% |
| 2021 | 26.08% |
| 2020 | -11.16% |
TFC Dividends
| Ex-Dividend Date | Type | Payout Amount | Change | ||||||
|---|---|---|---|---|---|---|---|---|---|
| Loading, please wait... | |||||||||


Loading social stream, please wait...