
TFS Financial Corporation (TFSL): Price and Financial Metrics
TFSL Price/Volume Stats
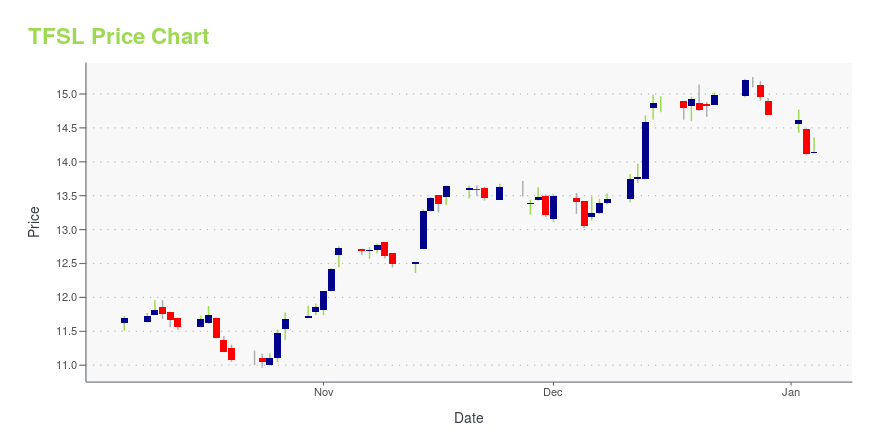
| Current price | $14.06 | 52-week high | $15.25 |
| Prev. close | $14.02 | 52-week low | $10.97 |
| Day low | $13.90 | Volume | 265,000 |
| Day high | $14.17 | Avg. volume | 272,025 |
| 50-day MA | $12.92 | Dividend yield | 8.12% |
| 200-day MA | $12.98 | Market Cap | 3.95B |
TFSL Stock Price Chart Interactive Chart >
TFS Financial Corporation (TFSL) Company Bio
TFS Financial operates as a holding company for Third Federal Savings and Loan Association of Cleveland that provides residential real estate mortgage loans and retail savings deposits in Ohio. The company was founded in 1938 and is based in Cleveland, Ohio.
Latest TFSL News From Around the Web
Below are the latest news stories about TFS FINANCIAL CORP that investors may wish to consider to help them evaluate TFSL as an investment opportunity.
TFS Financial Corp's Dividend AnalysisTFS Financial Corp (NASDAQ:TFSL) recently announced a dividend of $0.28 per share, payable on 2023-12-13, with the ex-dividend date set for 2023-11-28. As investors look forward to this upcoming payment, the spotlight also shines on the company's dividend history, yield, and growth rates. Using the data from GuruFocus, let's look into TFS Financial Corp's dividend performance and assess its sustainability. |
Trimming the Fat: 3 Overvalued Stocks to Shed Before 2024An always uncomfortable topic, overvalued stocks to sell arouses intense emotions for understandable reasons. |
11 Best High-Dividend Stocks to Buy NowIn this article, we discuss 11 best high-dividend stocks to buy now. You can skip our detailed analysis of dividend stocks and their performance in the past, and go directly to read 5 Best High-Dividend Stocks to Buy Now. In Lowell Miller’s book, Single Best Investment, he referenced a study by J. Grant in the […] |
TFS Financial Corporation Declares DividendCLEVELAND, November 15, 2023--TFS Financial Corporation (NASDAQ: TFSL) (the "Company"), the holding company for Third Federal Savings and Loan Association of Cleveland (the "Association"), today announced that the Board of Directors declared a quarterly cash dividend of $0.2825 per share, payable on December 13, 2023, to stockholders of record on November 29, 2023. |
12 Best Dividend Stocks Under $20In this article, we discuss 12 best dividend stocks under $20. You can skip our detailed analysis of dividend stocks and their performance in the past, and go directly to read 5 Best Dividend Stocks Under $20. In 2023, dividend-paying stocks faced difficulties, but experienced investors understand that short-term setbacks don’t deter them. They know […] |
TFSL Price Returns
| 1-mo | 13.30% |
| 3-mo | 17.93% |
| 6-mo | 5.08% |
| 1-year | 11.99% |
| 3-year | -8.41% |
| 5-year | 8.80% |
| YTD | 0.08% |
| 2023 | 11.17% |
| 2022 | -12.99% |
| 2021 | 7.12% |
| 2020 | -4.53% |
| 2019 | 29.24% |
TFSL Dividends
| Ex-Dividend Date | Type | Payout Amount | Change | ||||||
|---|---|---|---|---|---|---|---|---|---|
| Loading, please wait... | |||||||||
Continue Researching TFSL
Here are a few links from around the web to help you further your research on TFS Financial CORP's stock as an investment opportunity:TFS Financial CORP (TFSL) Stock Price | Nasdaq
TFS Financial CORP (TFSL) Stock Quote, History and News - Yahoo Finance
TFS Financial CORP (TFSL) Stock Price and Basic Information | MarketWatch
Loading social stream, please wait...