
Tredegar Corporation (TG): Price and Financial Metrics
TG Price/Volume Stats
| Current price | $6.00 | 52-week high | $7.09 |
| Prev. close | $6.03 | 52-week low | $3.98 |
| Day low | $5.84 | Volume | 49,800 |
| Day high | $6.16 | Avg. volume | 127,384 |
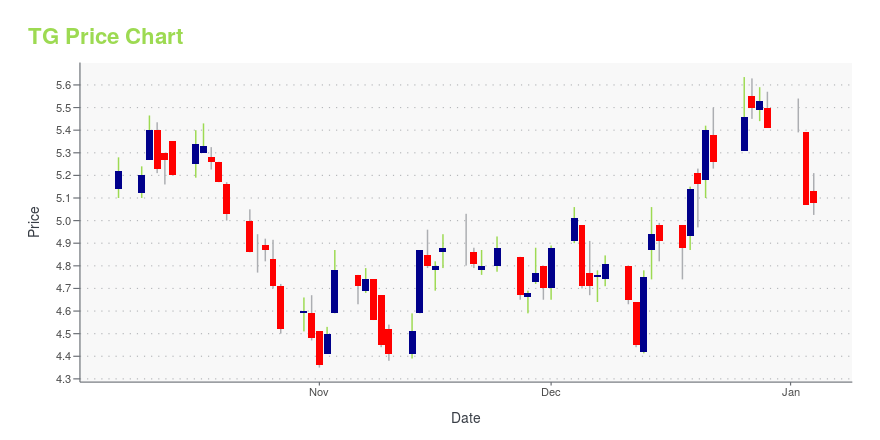
| 50-day MA | $5.24 | Dividend yield | N/A |
| 200-day MA | $5.22 | Market Cap | 206.91M |
TG Stock Price Chart Interactive Chart >
Tredegar Corporation (TG) Company Bio
Tredegar Corporation manufactures and sells plastic films and aluminum extrusions worldwide. It operates through two segments, Film Products and Aluminum Extrusions. The company was founded in 1988 and is based in Richmond, Virginia.
Latest TG News From Around the Web
Below are the latest news stories about TREDEGAR CORP that investors may wish to consider to help them evaluate TG as an investment opportunity.
Terphane is Awarded GREAT PLACE TO WORK "Best Place to Work - Industry" in Brazil For Fourth Consecutive YearSÃO PAULO, December 20, 2023--Terphane is Awarded GREAT PLACE TO WORK "Best Place to Work - Industry" in Brazil For Fourth Consecutive Year |
3 Underperforming Aluminum Stocks You Better Not Be BuyingInvestors would do well to stay away from these aluminum stocks altogether or sell should they currently have positions. |
Investors in Tredegar (NYSE:TG) have unfortunately lost 66% over the last three yearsThe truth is that if you invest for long enough, you're going to end up with some losing stocks. But the last three... |
Bonnell Aluminum Commenting on Initial Determination by ITCNEWNAN, Ga., November 20, 2023--Bonnell Aluminum Commenting on Initial Ruling by ITC |
A Look At The Intrinsic Value Of Tredegar Corporation (NYSE:TG)Key Insights Tredegar's estimated fair value is US$4.50 based on 2 Stage Free Cash Flow to Equity Tredegar's US$4.41... |
TG Price Returns
| 1-mo | 36.99% |
| 3-mo | -8.54% |
| 6-mo | 22.20% |
| 1-year | -11.50% |
| 3-year | -48.44% |
| 5-year | -20.62% |
| YTD | 10.91% |
| 2023 | -45.17% |
| 2022 | -9.59% |
| 2021 | -26.75% |
| 2020 | 48.04% |
| 2019 | 44.44% |
Continue Researching TG
Want to do more research on Tredegar Corp's stock and its price? Try the links below:Tredegar Corp (TG) Stock Price | Nasdaq
Tredegar Corp (TG) Stock Quote, History and News - Yahoo Finance
Tredegar Corp (TG) Stock Price and Basic Information | MarketWatch
Loading social stream, please wait...