Treehouse Foods, Inc. (THS): Price and Financial Metrics
GET POWR RATINGS... FREE!
THS POWR Grades
- Growth is the dimension where THS ranks best; there it ranks ahead of 91% of US stocks.
- THS's strongest trending metric is Momentum; it's been moving down over the last 177 days.
- THS ranks lowest in Quality; there it ranks in the 36th percentile.
THS Stock Summary
- Over the past twelve months, THS has reported earnings growth of -205.91%, putting it ahead of merely 7.76% of US stocks in our set.
- As for revenue growth, note that THS's revenue has grown -20.19% over the past 12 months; that beats the revenue growth of merely 9.46% of US companies in our set.
- In terms of volatility of its share price, THS is more volatile than just 3.79% of stocks we're observing.
- Stocks that are quantitatively similar to THS, based on their financial statements, market capitalization, and price volatility, are MD, HRT, HGV, NPO, and WRK.
- THS's SEC filings can be seen here. And to visit TREEHOUSE FOODS INC's official web site, go to www.treehousefoods.com.
THS Valuation Summary
- In comparison to the median Consumer Defensive stock, THS's price/earnings ratio is 186.57% lower, now standing at -18.7.
- THS's price/earnings ratio has moved down 44.7 over the prior 216 months.
Below are key valuation metrics over time for THS.
Stock | Date | P/S | P/B | P/E | EV/EBIT |
---|---|---|---|---|---|
THS | 2023-03-24 | 0.8 | 1.6 | -18.7 | -62.4 |
THS | 2023-03-23 | 0.8 | 1.6 | -18.2 | -61.3 |
THS | 2023-03-22 | 0.8 | 1.6 | -18.2 | -61.3 |
THS | 2023-03-21 | 0.8 | 1.6 | -18.4 | -61.7 |
THS | 2023-03-20 | 0.8 | 1.6 | -18.6 | -62.0 |
THS | 2023-03-17 | 0.7 | 1.5 | -17.5 | -59.8 |
THS Growth Metrics
- Its 3 year cash and equivalents growth rate is now at 144.05%.
- The year over year cash and equivalents growth rate now stands at 295.08%.
- The 5 year cash and equivalents growth rate now stands at 391.67%.

The table below shows THS's growth in key financial areas (numbers in millions of US dollars).
Date | Revenue | Operating Cash Flow | Net Income to Common Stock |
---|---|---|---|
2022-12-31 | 3,454 | -150.7 | -146.3 |
2022-09-30 | 4,379.5 | 156.6 | -152 |
2022-06-30 | 4,605.7 | 349.1 | -54.8 |
2022-03-31 | 4,411.3 | 262.9 | -17 |
2021-12-31 | 4,327.6 | 324.9 | -12.5 |
2021-09-30 | 4,338.9 | 348 | 51 |
THS's Quality Factors
The “Quality” component of the POWR Ratings focuses on 31 different factors of a companies fundamentals and operational strength. Here are some key insights as we drill into the specifics of these quality attributes.- THS has a Quality Grade of D, ranking ahead of 11.2% of graded US stocks.
- THS's asset turnover comes in at 0.812 -- ranking 33rd of 59 Food Products stocks.
- FLO, LANC, and KHC are the stocks whose asset turnover ratios are most correlated with THS.
The table below shows THS's key quality metrics over time.
Period | Asset Turnover | Gross Margin | ROIC |
---|---|---|---|
2021-06-30 | 0.812 | 0.178 | 0.041 |
2021-03-31 | 0.813 | 0.182 | 0.044 |
2020-12-31 | 0.814 | 0.184 | 0.023 |
2020-09-30 | 0.820 | 0.185 | 0.023 |
2020-06-30 | 0.827 | 0.184 | -0.040 |
2020-03-31 | 0.853 | 0.178 | -0.091 |
THS Price Target
For more insight on analysts targets of THS, see our THS price target page. And for a list of of all stocks sorted by upside potential based on analyst target price, see our Top Price Target page.
Average Price Target | $42.38 | Average Broker Recommendation | 1.83 (Hold) |
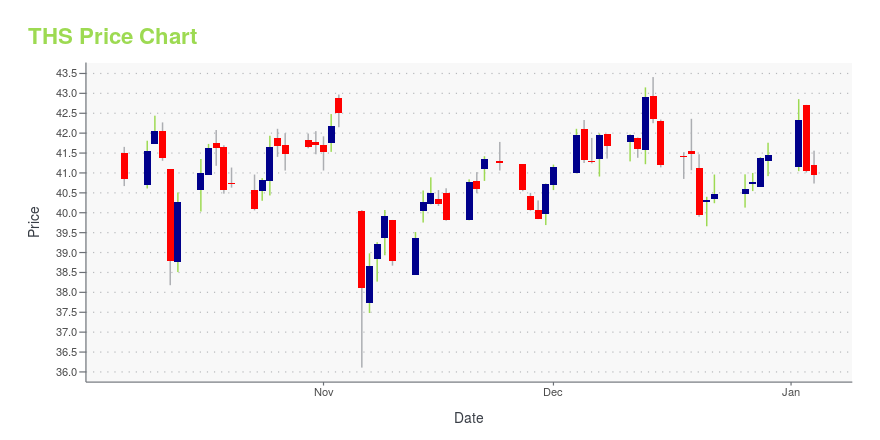
THS Stock Price Chart Interactive Chart >
THS Price/Volume Stats
Current price | $50.43 | 52-week high | $51.55 |
Prev. close | $49.87 | 52-week low | $30.06 |
Day low | $49.42 | Volume | 414,500 |
Day high | $50.74 | Avg. volume | 338,503 |
50-day MA | $48.18 | Dividend yield | N/A |
200-day MA | $46.54 | Market Cap | 2.83B |
Treehouse Foods, Inc. (THS) Company Bio
TreeHouse Foods operates as a food and beverage manufacturer in the United States and Canada. The company's product categories include beverages, salad dressings, snacks, beverage enhancers, pickles, Mexican and other sauces, soup and infant feeding, cereals, dry dinners, aseptic products, jams and other products. The company was founded in 2005 and is based in Oak Brook, Illinois.
Latest THS News From Around the Web
Below are the latest news stories about TREEHOUSE FOODS INC that investors may wish to consider to help them evaluate THS as an investment opportunity.
TreeHouse Foods Full Year 2022 Earnings: EPS Misses ExpectationsTreeHouse Foods ( NYSE:THS ) Full Year 2022 Results Key Financial Results Revenue: US$3.45b (up 17% from FY 2021). Net... |
Is TreeHouse Foods, Inc. (NYSE:THS) Expensive For A Reason? A Look At Its Intrinsic ValueHow far off is TreeHouse Foods, Inc. ( NYSE:THS ) from its intrinsic value? Using the most recent financial data, we'll... |
TreeHouse Foods, Inc. (NYSE:THS) Q4 2022 Earnings Call TranscriptTreeHouse Foods, Inc. (NYSE:THS) Q4 2022 Earnings Call Transcript February 13, 2023 Operator: Welcome to the TreeHouse Foods’ Fourth Quarter 2022 Conference Call. All participants will be in listen-only mode. After today’s presentation, there will be an opportunity to ask questions. Please note that this event is being recorded. At this time, I would like […] |
TreeHouse Foods (THS) Q4 Earnings Top Estimates, Sales MissTreeHouse Foods' (THS) fourth-quarter fiscal 2022 results reflect higher sales and earnings, year over year. Pricing remains an upside, labor and supply-chain hurdles persist. |
TreeHouse Foods Posts Mixed Q4 Earnings; Warns On Inflationary Macro EnvironmentTreeHouse Foods Inc (NYSE: THS) reported fourth-quarter FY22 sales growth of 22% year-on-year to $996.20 million, missing the consensus of $1.02 billion. The revenue increase was primarily driven by favorable pricing to recover commodity inflation. Gross margin for the quarter expanded 280 basis points Y/Y to 17.7%. The company reported an operating income of $70 million with an operating margin of 7%. The operating expenses fell 28.4% Y/Y to $105.9 million. Adjusted EPS of $0.98 beat the analys |
THS Price Returns
1-mo | 2.21% |
3-mo | 2.13% |
6-mo | 16.33% |
1-year | 50.45% |
3-year | 15.16% |
5-year | 33.84% |
YTD | 2.13% |
2022 | 21.84% |
2021 | -4.61% |
2020 | -12.39% |
2019 | -4.36% |
2018 | 2.53% |
Continue Researching THS
Want to see what other sources are saying about TreeHouse Foods Inc's financials and stock price? Try the links below:TreeHouse Foods Inc (THS) Stock Price | Nasdaq
TreeHouse Foods Inc (THS) Stock Quote, History and News - Yahoo Finance
TreeHouse Foods Inc (THS) Stock Price and Basic Information | MarketWatch
Loading social stream, please wait...