Thermo Fisher Scientific Inc. (TMO): Price and Financial Metrics
TMO Price/Volume Stats
Current price | $502.79 | 52-week high | $609.85 |
Prev. close | $501.59 | 52-week low | $475.77 |
Day low | $501.57 | Volume | 1,197,900 |
Day high | $507.16 | Avg. volume | 1,496,164 |
50-day MA | $537.94 | Dividend yield | 0.28% |
200-day MA | $546.83 | Market Cap | 194.05B |
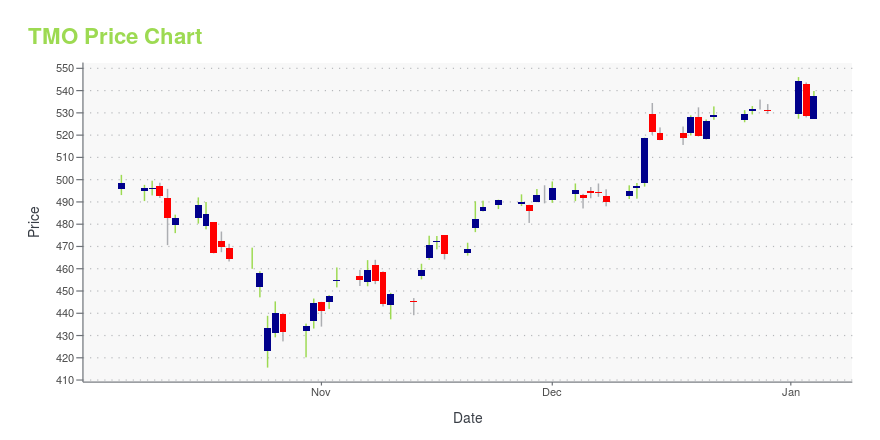
TMO Stock Price Chart Interactive Chart >
TMO POWR Grades
- Stability is the dimension where TMO ranks best; there it ranks ahead of 90.39% of US stocks.
- The strongest trend for TMO is in Stability, which has been heading up over the past 179 days.
- TMO ranks lowest in Momentum; there it ranks in the 10th percentile.
TMO Stock Summary
- TMO has a higher market value than 99.14% of US stocks; more precisely, its current market capitalization is $195,958,278,245.
- TMO's went public 36.08 years ago, making it older than 91.94% of listed US stocks we're tracking.
- The volatility of THERMO FISHER SCIENTIFIC INC's share price is greater than that of only 2.79% US stocks with at least 200 days of trading history.
- Stocks that are quantitatively similar to TMO, based on their financial statements, market capitalization, and price volatility, are DHR, ABT, SHEL, CMCSA, and HSBC.
- Visit TMO's SEC page to see the company's official filings. To visit the company's web site, go to www.thermofisher.com.
TMO Valuation Summary
- TMO's price/earnings ratio is 34.3; this is 25.87% higher than that of the median Healthcare stock.
- TMO's EV/EBIT ratio has moved up 17.9 over the prior 243 months.
Below are key valuation metrics over time for TMO.
Stock | Date | P/S | P/B | P/E | EV/EBIT |
---|---|---|---|---|---|
TMO | 2023-09-18 | 4.5 | 4.5 | 34.3 | 32.0 |
TMO | 2023-09-15 | 4.6 | 4.5 | 34.8 | 32.4 |
TMO | 2023-09-14 | 4.6 | 4.5 | 34.8 | 32.4 |
TMO | 2023-09-13 | 4.5 | 4.5 | 34.5 | 32.2 |
TMO | 2023-09-12 | 4.5 | 4.5 | 34.5 | 32.2 |
TMO | 2023-09-11 | 4.6 | 4.5 | 34.7 | 32.4 |
TMO Growth Metrics
- Its 4 year price growth rate is now at 92.8%.
- Its 5 year net income to common stockholders growth rate is now at 69%.
- The year over year price growth rate now stands at 16.7%.

The table below shows TMO's growth in key financial areas (numbers in millions of US dollars).
Date | Revenue | Operating Cash Flow | Net Income to Common Stock |
---|---|---|---|
2022-09-30 | 44,167 | 8,124 | 7,032 |
2022-06-30 | 42,820 | 8,837 | 7,439 |
2022-03-31 | 41,123 | 9,536 | 7,603 |
2021-12-31 | 39,211 | 9,312 | 7,725 |
2021-09-30 | 39,059 | 10,194 | 8,565 |
2021-06-30 | 38,250 | 10,252 | 8,596 |
TMO's Quality Factors
The “Quality” component of the POWR Ratings focuses on 31 different factors of a companies fundamentals and operational strength. Here are some key insights as we drill into the specifics of these quality attributes.- TMO has a Quality Grade of C, ranking ahead of 62.66% of graded US stocks.
- TMO's asset turnover comes in at 0.574 -- ranking 43rd of 75 Measuring and Control Equipment stocks.
- PACB, PKI, and PRPO are the stocks whose asset turnover ratios are most correlated with TMO.
The table below shows TMO's key quality metrics over time.
Period | Asset Turnover | Gross Margin | ROIC |
---|---|---|---|
2021-07-03 | 0.574 | 0.513 | 0.323 |
2021-04-03 | 0.551 | 0.515 | 0.302 |
2020-12-31 | 0.509 | 0.497 | 0.244 |
2020-09-26 | 0.470 | 0.473 | 0.209 |
2020-06-27 | 0.446 | 0.454 | 0.166 |
2020-03-28 | 0.443 | 0.443 | 0.174 |
TMO Price Target
For more insight on analysts targets of TMO, see our TMO price target page. And for a list of of all stocks sorted by upside potential based on analyst target price, see our Top Price Target page.
Average Price Target | $586.74 | Average Broker Recommendation | 1.36 (Strong Buy) |
Thermo Fisher Scientific Inc. (TMO) Company Bio
Thermo Fisher Scientific is an American provisioner of scientific instrumentation, reagents and consumables, and software and services to healthcare, life science, and other laboratories in academia, government, and industry (including in the biotechnology and pharmaceutical sectors). Based in Waltham, Massachusetts, Thermo Fisher was created in 2006 by the merger of Thermo Electron and Fisher Scientific, to form a company with US$ 9 billion in combined revenues. (Source:Wikipedia)
Latest TMO News From Around the Web
Below are the latest news stories about THERMO FISHER SCIENTIFIC INC that investors may wish to consider to help them evaluate TMO as an investment opportunity.
With 90% ownership, Thermo Fisher Scientific Inc. (NYSE:TMO) boasts of strong institutional backingKey Insights Institutions' substantial holdings in Thermo Fisher Scientific implies that they have significant... |
Thermo Fisher Scientific (TMO) Stock Moves -0.76%: What You Should KnowThermo Fisher Scientific (TMO) closed the most recent trading day at $504.89, moving -0.76% from the previous trading session. |
Obesity-Drug Mania Propels Top Stock Fund to Beat 94% of Peers(Bloomberg) -- A top-performing equity fund with years-long investments in the insulin makers behind the recent weight-loss stock frenzy is betting the rally has further to run.Most Read from BloombergVegas’ Newest Resort Is a $3.7 Billion Palace, 23 Years in the MakingTrudeau’s Murder Claim Risks Upending US Courtship of IndiaDollar Rally Is Crushing One of the Most Popular Trades of 2023F-35 Debris Found After a $100 Million Fighter Jet Went MissingNovo Nordisk A/S and Eli Lilly & Co. are amon |
UPDATE 2-Moderna to cut mRNA drug substance production at Lonza facilityModerna said on Tuesday it will cut production of mRNA drug substance for its COVID-19 vaccine at Lonza's facility in Switzerland this quarter as part of a plan to align manufacturing of the shots with lower post-pandemic demand. The U.S. company had said last week it was in talks with its partners that fill vials and syringes globally to downsize vaccine production. Such a move will help Moderna adjust to the sharp fall in demand for COVID vaccines as payers cut back orders for the shots, partly following the end of the public health emergency for the disease. |
Thermo Fisher Scientific (TMO) Stock Sinks As Market Gains: What You Should KnowThermo Fisher Scientific (TMO) closed at $507.73 in the latest trading session, marking a -1.51% move from the prior day. |
TMO Price Returns
1-mo | -6.48% |
3-mo | -4.02% |
6-mo | -10.37% |
1-year | -3.21% |
3-year | 20.30% |
5-year | 110.13% |
YTD | -8.52% |
2022 | -17.29% |
2021 | 43.54% |
2020 | 43.72% |
2019 | 45.55% |
2018 | 18.21% |
TMO Dividends
Ex-Dividend Date | Type | Payout Amount | Change | ||||||
---|---|---|---|---|---|---|---|---|---|
Loading, please wait... |
Continue Researching TMO
Want to do more research on Thermo Fisher Scientific Inc's stock and its price? Try the links below:Thermo Fisher Scientific Inc (TMO) Stock Price | Nasdaq
Thermo Fisher Scientific Inc (TMO) Stock Quote, History and News - Yahoo Finance
Thermo Fisher Scientific Inc (TMO) Stock Price and Basic Information | MarketWatch
Loading social stream, please wait...