
Tennant Company (TNC): Price and Financial Metrics
TNC Price/Volume Stats
| Current price | $68.18 | 52-week high | $119.71 |
| Prev. close | $69.99 | 52-week low | $67.57 |
| Day low | $67.57 | Volume | 103,300 |
| Day high | $69.39 | Avg. volume | 182,143 |
| 50-day MA | $81.44 | Dividend yield | 1.69% |
| 200-day MA | $88.88 | Market Cap | 1.28B |
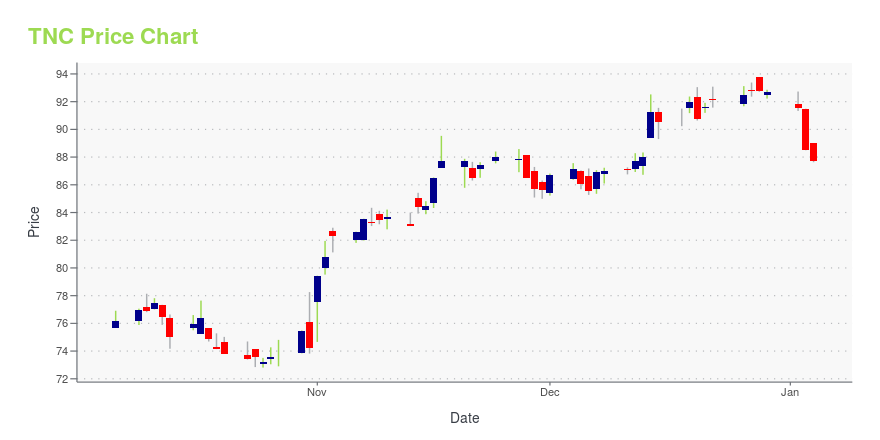
TNC Stock Price Chart Interactive Chart >
Tennant Company (TNC) Company Bio
Tennant Company delivers products including equipment for maintaining surfaces in industrial, commercial and outdoor environments; chemical-free and other sustainable cleaning technologies; and coatings for protecting, repairing and upgrading surfaces. The company was founded in 1870 and is based in Minneapolis, Minnesota.
TNC Price Returns
| 1-mo | -16.81% |
| 3-mo | -20.70% |
| 6-mo | -23.84% |
| 1-year | -40.06% |
| 3-year | -4.28% |
| 5-year | 19.44% |
| YTD | -16.08% |
| 2024 | -11.03% |
| 2023 | 52.62% |
| 2022 | -22.83% |
| 2021 | 16.87% |
| 2020 | -8.79% |
TNC Dividends
| Ex-Dividend Date | Type | Payout Amount | Change | ||||||
|---|---|---|---|---|---|---|---|---|---|
| Loading, please wait... | |||||||||
Continue Researching TNC
Here are a few links from around the web to help you further your research on Tennant Co's stock as an investment opportunity:Tennant Co (TNC) Stock Price | Nasdaq
Tennant Co (TNC) Stock Quote, History and News - Yahoo Finance
Tennant Co (TNC) Stock Price and Basic Information | MarketWatch
Loading social stream, please wait...