
Tennant Company (TNC): Price and Financial Metrics
TNC Price/Volume Stats
| Current price | $108.78 | 52-week high | $124.11 |
| Prev. close | $108.22 | 52-week low | $72.81 |
| Day low | $108.07 | Volume | 85,050 |
| Day high | $110.45 | Avg. volume | 126,844 |
| 50-day MA | $101.49 | Dividend yield | 1.03% |
| 200-day MA | $98.80 | Market Cap | 2.07B |
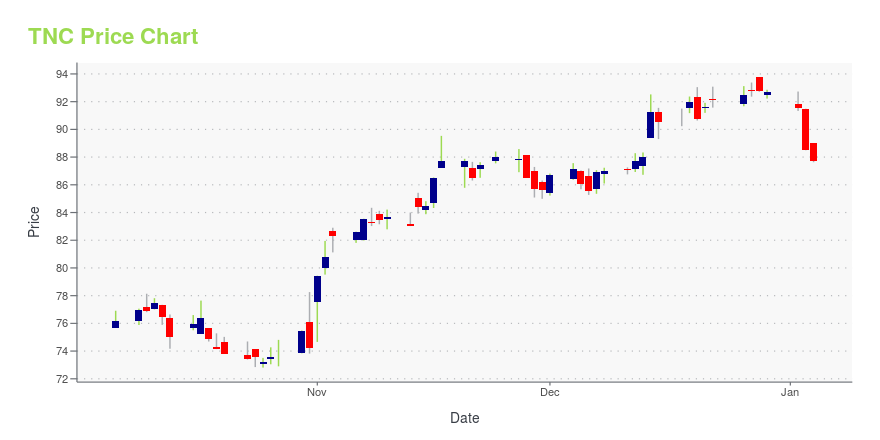
TNC Stock Price Chart Interactive Chart >
Tennant Company (TNC) Company Bio
Tennant Company delivers products including equipment for maintaining surfaces in industrial, commercial and outdoor environments; chemical-free and other sustainable cleaning technologies; and coatings for protecting, repairing and upgrading surfaces. The company was founded in 1870 and is based in Minneapolis, Minnesota.
Latest TNC News From Around the Web
Below are the latest news stories about TENNANT CO that investors may wish to consider to help them evaluate TNC as an investment opportunity.
7 Dividend Kings for Royal Returns in 2024Dividend growth, earnings growth, and an improving macro outlook could propel these seven dividend kings to new heights in 2024. |
Tennant (NYSE:TNC) Shareholders Will Want The ROCE Trajectory To ContinueIf we want to find a stock that could multiply over the long term, what are the underlying trends we should look for... |
Is It Too Late To Consider Buying Tennant Company (NYSE:TNC)?While Tennant Company ( NYSE:TNC ) might not be the most widely known stock at the moment, it saw a double-digit share... |
Should You Buy Tennant Company (NYSE:TNC) For Its Upcoming Dividend?It looks like Tennant Company ( NYSE:TNC ) is about to go ex-dividend in the next four days. The ex-dividend date... |
Is Tennant Company (NYSE:TNC) Trading At A 27% Discount?Key Insights Tennant's estimated fair value is US$118 based on 2 Stage Free Cash Flow to Equity Tennant's US$86.48... |
TNC Price Returns
| 1-mo | 11.55% |
| 3-mo | -5.67% |
| 6-mo | 18.48% |
| 1-year | 39.88% |
| 3-year | 46.41% |
| 5-year | 76.15% |
| YTD | 17.97% |
| 2023 | 52.62% |
| 2022 | -22.84% |
| 2021 | 16.88% |
| 2020 | -8.78% |
| 2019 | 51.57% |
TNC Dividends
| Ex-Dividend Date | Type | Payout Amount | Change | ||||||
|---|---|---|---|---|---|---|---|---|---|
| Loading, please wait... | |||||||||
Continue Researching TNC
Here are a few links from around the web to help you further your research on Tennant Co's stock as an investment opportunity:Tennant Co (TNC) Stock Price | Nasdaq
Tennant Co (TNC) Stock Quote, History and News - Yahoo Finance
Tennant Co (TNC) Stock Price and Basic Information | MarketWatch
Loading social stream, please wait...