Toll Brothers, Inc. (TOL): Price and Financial Metrics
TOL Price/Volume Stats
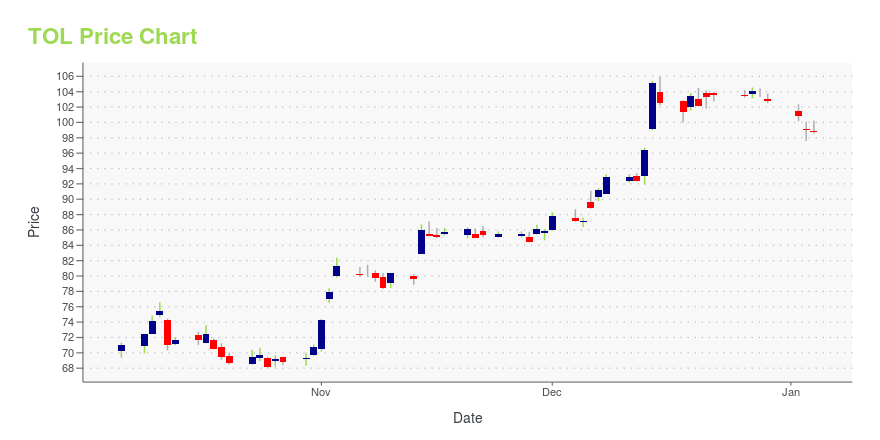
Current price | $74.07 | 52-week high | $84.57 |
Prev. close | $73.63 | 52-week low | $39.53 |
Day low | $73.47 | Volume | 1,726,645 |
Day high | $74.69 | Avg. volume | 1,604,230 |
50-day MA | $79.45 | Dividend yield | 1.08% |
200-day MA | $66.20 | Market Cap | 7.96B |
TOL Stock Price Chart Interactive Chart >
TOL POWR Grades
- Momentum is the dimension where TOL ranks best; there it ranks ahead of 99.98% of US stocks.
- The strongest trend for TOL is in Quality, which has been heading up over the past 179 days.
- TOL's current lowest rank is in the Stability metric (where it is better than 24.22% of US stocks).
TOL Stock Summary
- TOLL BROTHERS INC's stock had its IPO on December 30, 1987, making it an older stock than 90.27% of US equities in our set.
- TOL's current price/earnings ratio is 5.34, which is higher than only 8.45% of US stocks with positive earnings.
- Of note is the ratio of TOLL BROTHERS INC's sales and general administrative expense to its total operating expenses; 87.22% of US stocks have a lower such ratio.
- Stocks that are quantitatively similar to TOL, based on their financial statements, market capitalization, and price volatility, are IVZ, TPR, SKX, POOL, and LSEA.
- TOL's SEC filings can be seen here. And to visit TOLL BROTHERS INC's official web site, go to www.tollbrothers.com.
TOL Valuation Summary
- TOL's price/sales ratio is 0.8; this is 14.29% higher than that of the median Consumer Cyclical stock.
- Over the past 243 months, TOL's price/earnings ratio has gone down 4.3.
Below are key valuation metrics over time for TOL.
Stock | Date | P/S | P/B | P/E | EV/EBIT |
---|---|---|---|---|---|
TOL | 2023-09-13 | 0.8 | 1.3 | 5.4 | 5.0 |
TOL | 2023-09-12 | 0.8 | 1.3 | 5.5 | 5.0 |
TOL | 2023-09-11 | 0.8 | 1.3 | 5.6 | 5.1 |
TOL | 2023-09-08 | 0.8 | 1.3 | 5.5 | 5.0 |
TOL | 2023-09-07 | 0.8 | 1.3 | 5.6 | 5.1 |
TOL | 2023-09-06 | 0.8 | 1.3 | 5.6 | 5.1 |
TOL Growth Metrics
- Its 3 year revenue growth rate is now at 25.75%.
- The year over year cash and equivalents growth rate now stands at -25.17%.
- Its 2 year price growth rate is now at 44.44%.

The table below shows TOL's growth in key financial areas (numbers in millions of US dollars).
Date | Revenue | Operating Cash Flow | Net Income to Common Stock |
---|---|---|---|
2022-09-30 | 10,275.56 | 986.816 | 1,286.5 |
2022-06-30 | 9,604.804 | 608.068 | 1,020.294 |
2022-03-31 | 9,365.483 | 1,070.888 | 981.759 |
2021-12-31 | 9,018.066 | 967.106 | 889.032 |
2021-09-30 | 8,790.361 | 1,303.127 | 833.627 |
2021-06-30 | 8,294.648 | 1,314.95 | 658.614 |
TOL's Quality Factors
The “Quality” component of the POWR Ratings focuses on 31 different factors of a companies fundamentals and operational strength. Here are some key insights as we drill into the specifics of these quality attributes.- TOL has a Quality Grade of C, ranking ahead of 43.81% of graded US stocks.
- TOL's asset turnover comes in at 0.751 -- ranking 46th of 51 Construction stocks.
- TPC, PHM, and AMRC are the stocks whose asset turnover ratios are most correlated with TOL.
The table below shows TOL's key quality metrics over time.
Period | Asset Turnover | Gross Margin | ROIC |
---|---|---|---|
2021-07-31 | 0.751 | 0.222 | 0.063 |
2021-04-30 | 0.708 | 0.213 | 0.052 |
2021-01-31 | 0.676 | 0.206 | 0.047 |
2020-10-31 | 0.658 | 0.200 | 0.042 |
2020-07-31 | 0.646 | 0.181 | 0.042 |
2020-04-30 | 0.658 | 0.185 | 0.045 |
TOL Price Target
For more insight on analysts targets of TOL, see our TOL price target page. And for a list of of all stocks sorted by upside potential based on analyst target price, see our Top Price Target page.
Average Price Target | $74.10 | Average Broker Recommendation | 1.81 (Hold) |
Toll Brothers, Inc. (TOL) Company Bio
Toll Brothers Inc. designs, builds, markets, and arranges finance for detached and attached homes in luxury residential communities in 19 states in the United States. The company was founded in 1967 and is based in Horsham, Pennsylvania.
Latest TOL News From Around the Web
Below are the latest news stories about TOLL BROTHERS INC that investors may wish to consider to help them evaluate TOL as an investment opportunity.
3 Stocks to Buy Now if You Think Fed Rate Cuts Are Still ComingWith core CPI remaining in check, the Fed is likely to cut rates relatively soon. |
Toll Brothers Announces Cash DividendFORT WASHINGTON, Pa., Sept. 19, 2023 (GLOBE NEWSWIRE) -- Toll Brothers, Inc. (NYSE:TOL) (TollBrothers.com), the nation's leading builder of luxury homes, today announced that its Board of Directors has approved a quarterly cash dividend to shareholders. The dividend of $0.21 per share will be paid on October 20, 2023 to shareholders of record on the close of business on October 6, 2023. ABOUT TOLL BROTHERSToll Brothers, Inc., a Fortune 500 Company, is the nation's leading builder of luxury homes |
Toll Brothers Announces New Luxury Townhome Community Coming Soon to the Civita Master PlanEverly at Civita offers luxury townhomes located in a resort-style community in San Diego Everly at Civita by Toll Brothers Everly at Civita by Toll Brothers offers home designs ranging from 1,458 to 2,301+ square feet in San Diego County. SAN DIEGO, Sept. 19, 2023 (GLOBE NEWSWIRE) -- Toll Brothers, Inc. (NYSE:TOL), the nation’s leading builder of luxury homes, today announced its highly anticipated luxury townhome community, Everly at Civita, is coming soon to the award-winning and highly sough |
Why Fast-paced Mover Toll Brothers (TOL) Is a Great Choice for Value InvestorsIf you are looking for stocks that have gained strong momentum recently but are still trading at reasonable prices, Toll Brothers (TOL) could be a great choice. It is one of the several stocks that passed through our 'Fast-Paced Momentum at a Bargain' screen. |
AECOM (ACM) Receives TxDOT Contract to Work as Lead DesignerAECOM's (ACM) recent deal to support the design, delivery and maintenance of the I-35 NEX South Project. |
TOL Price Returns
1-mo | -6.06% |
3-mo | -2.40% |
6-mo | 27.59% |
1-year | 78.56% |
3-year | 59.86% |
5-year | 120.66% |
YTD | 49.89% |
2022 | -29.97% |
2021 | 68.43% |
2020 | 11.53% |
2019 | 21.40% |
2018 | -30.69% |
TOL Dividends
Ex-Dividend Date | Type | Payout Amount | Change | ||||||
---|---|---|---|---|---|---|---|---|---|
Loading, please wait... |
Continue Researching TOL
Here are a few links from around the web to help you further your research on Toll Brothers Inc's stock as an investment opportunity:Toll Brothers Inc (TOL) Stock Price | Nasdaq
Toll Brothers Inc (TOL) Stock Quote, History and News - Yahoo Finance
Toll Brothers Inc (TOL) Stock Price and Basic Information | MarketWatch
Loading social stream, please wait...