
TriplePoint Venture Growth BDC Corp. (TPVG): Price and Financial Metrics
TPVG Price/Volume Stats
| Current price | $8.99 | 52-week high | $12.70 |
| Prev. close | $8.93 | 52-week low | $7.91 |
| Day low | $8.83 | Volume | 401,012 |
| Day high | $9.00 | Avg. volume | 341,236 |
| 50-day MA | $8.81 | Dividend yield | 17.98% |
| 200-day MA | $9.85 | Market Cap | 340.24M |
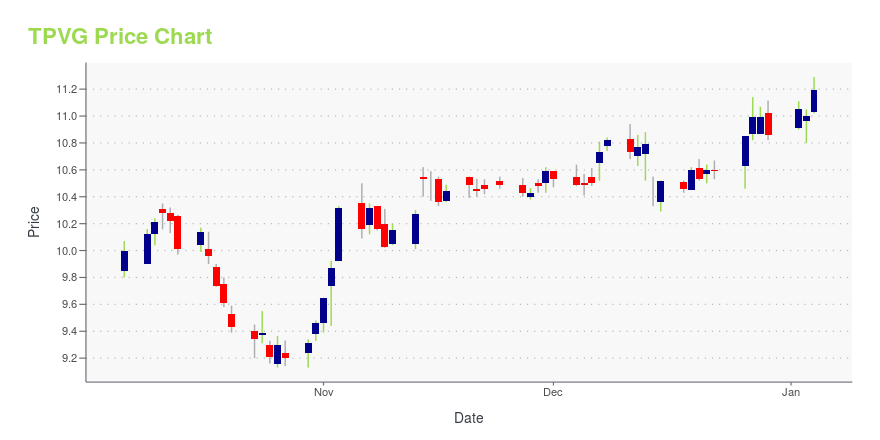
TPVG Stock Price Chart Interactive Chart >
TriplePoint Venture Growth BDC Corp. (TPVG) Company Bio
TriplePoint Venture Growth BDC Corp is a business development company specializing investments in growth stage. It also provides debt financing to venture growth space companies which includes growth capital loans, equipment financings, revolving loans, and direct equity investments. The fund seeks to invest in e-commerce, entertainment, technology and life sciences sector. The company is based in Menlo Park, California.
Latest TPVG News From Around the Web
Below are the latest news stories about TRIPLEPOINT VENTURE GROWTH BDC CORP that investors may wish to consider to help them evaluate TPVG as an investment opportunity.
TriplePoint Venture Growth BDC Corp. (NYSE:TPVG) Q3 2023 Earnings Call TranscriptTriplePoint Venture Growth BDC Corp. (NYSE:TPVG) Q3 2023 Earnings Call Transcript November 1, 2023 Operator: Good afternoon, ladies and gentlemen. Welcome to the TriplePoint Venture Growth BDC Corp. Third Quarter 2023 Earnings Conference Call. [Operator Instructions]. This conference is being recorded, and a replay of the call will be available in an audio webcast on […] |
TriplePoint Venture Growth BDC Corp. Announces Third Quarter 2023 Financial ResultsMENLO PARK, Calif., November 01, 2023--TriplePoint Venture Growth BDC Corp. (NYSE: TPVG) (the "Company," "TPVG," "we," "us," or "our"), the leading financing provider to venture growth stage companies backed by a select group of venture capital firms in technology and other high growth industries, today announced its financial results for the third quarter ended September 30, 2023 and the declaration by its Board of Directors of its fourth quarter 2023 distribution of $0.40 per share. |
3 Dividend Stocks to Avoid at All Costs: October 2023The economy is weakening, and these three dividend stocks to sell could take a hit as the damage spreads. |
TriplePoint Venture Growth BDC Corp. to Announce 2023 Third Quarter Financial Results on Wednesday, November 1, 2023MENLO PARK, Calif., October 18, 2023--TriplePoint Venture Growth BDC Corp. (NYSE: TPVG) (the "Company"), the leading financing provider to venture growth stage companies backed by a select group of venture capital firms in technology and other high growth industries, today announced it will release its financial results for its third quarter ended September 30, 2023 after market-close on Wednesday, November 1, 2023. James P. Labe, chief executive officer and chairman of the board, Sajal K. Sriva |
Today’s Biggest Pre-Market Stock Movers: 10 Top Gainers and Losers on ThursdayWe're starting off the day with a breakdown of all the biggest pre-market stock movers worth reading about on Thursday morning! |
TPVG Price Returns
| 1-mo | 12.80% |
| 3-mo | -1.70% |
| 6-mo | -14.77% |
| 1-year | -15.07% |
| 3-year | -17.06% |
| 5-year | 13.91% |
| YTD | -9.91% |
| 2023 | 20.29% |
| 2022 | -34.66% |
| 2021 | 50.54% |
| 2020 | 5.70% |
| 2019 | 44.22% |
TPVG Dividends
| Ex-Dividend Date | Type | Payout Amount | Change | ||||||
|---|---|---|---|---|---|---|---|---|---|
| Loading, please wait... | |||||||||
Continue Researching TPVG
Want to see what other sources are saying about TriplePoint Venture Growth BDC Corp's financials and stock price? Try the links below:TriplePoint Venture Growth BDC Corp (TPVG) Stock Price | Nasdaq
TriplePoint Venture Growth BDC Corp (TPVG) Stock Quote, History and News - Yahoo Finance
TriplePoint Venture Growth BDC Corp (TPVG) Stock Price and Basic Information | MarketWatch
Loading social stream, please wait...