Tootsie Roll Industries, Inc. (TR): Price and Financial Metrics
GET POWR RATINGS... FREE!
TR POWR Grades
- TR scores best on the Quality dimension, with a Quality rank ahead of 87.49% of US stocks.
- TR's strongest trending metric is Momentum; it's been moving down over the last 179 days.
- TR's current lowest rank is in the Value metric (where it is better than 8.55% of US stocks).
TR Stock Summary
- With a one year PEG ratio of 271.16, TOOTSIE ROLL INDUSTRIES INC is expected to have a higher PEG ratio (a measure of how expensive a stock is relative to its expected earnings growth) than 89.17% of US stocks.
- TR's went public 35.25 years ago, making it older than 90.7% of listed US stocks we're tracking.
- Price to trailing twelve month operating cash flow for TR is currently 41.46, higher than 89.71% of US stocks with positive operating cash flow.
- Stocks that are quantitatively similar to TR, based on their financial statements, market capitalization, and price volatility, are CIX, CVR, MSN, WAFU, and GRNQ.
- Visit TR's SEC page to see the company's official filings. To visit the company's web site, go to www.tootsie.com.
TR Valuation Summary
- TR's price/sales ratio is 4.6; this is 142.11% higher than that of the median Consumer Defensive stock.
- Over the past 243 months, TR's price/earnings ratio has gone up 20.2.
Below are key valuation metrics over time for TR.
Stock | Date | P/S | P/B | P/E | EV/EBIT |
---|---|---|---|---|---|
TR | 2023-02-24 | 4.6 | 3.9 | 43.4 | 32.5 |
TR | 2023-02-23 | 4.6 | 3.9 | 43.7 | 32.7 |
TR | 2023-02-22 | 4.6 | 3.9 | 43.6 | 32.7 |
TR | 2023-02-21 | 4.7 | 3.9 | 43.8 | 32.8 |
TR | 2023-02-17 | 4.8 | 4.1 | 45.1 | 33.7 |
TR | 2023-02-16 | 4.6 | 3.9 | 43.7 | 32.7 |
TR Growth Metrics
- Its 5 year net income to common stockholders growth rate is now at 0.42%.
- Its 5 year revenue growth rate is now at 1.48%.
- Its 5 year price growth rate is now at 8.89%.

The table below shows TR's growth in key financial areas (numbers in millions of US dollars).
Date | Revenue | Operating Cash Flow | Net Income to Common Stock |
---|---|---|---|
2022-09-30 | 665.174 | 83.741 | 70.625 |
2022-06-30 | 636.166 | 75.137 | 68.781 |
2022-03-31 | 608.184 | 86.768 | 66.586 |
2021-12-31 | 570.776 | 85.298 | 65.326 |
2021-09-30 | 531.716 | 82.775 | 60.246 |
2021-06-30 | 505.348 | 74.608 | 60.186 |
TR's Quality Factors
The “Quality” component of the POWR Ratings focuses on 31 different factors of a companies fundamentals and operational strength. Here are some key insights as we drill into the specifics of these quality attributes.- TR has a Quality Grade of B, ranking ahead of 78.41% of graded US stocks.
- TR's asset turnover comes in at 0.513 -- ranking 41st of 59 Food Products stocks.
- JJSF, LW, and SENEA are the stocks whose asset turnover ratios are most correlated with TR.
The table below shows TR's key quality metrics over time.
Period | Asset Turnover | Gross Margin | ROIC |
---|---|---|---|
2021-06-30 | 0.513 | 0.356 | 0.143 |
2021-03-31 | 0.480 | 0.362 | 0.140 |
2020-12-31 | 0.484 | 0.362 | 0.145 |
2020-09-30 | 0.491 | 0.367 | 0.145 |
2020-06-30 | 0.517 | 0.371 | 0.156 |
2020-03-31 | 0.547 | 0.373 | 0.162 |
TR Stock Price Chart Interactive Chart >
TR Price/Volume Stats
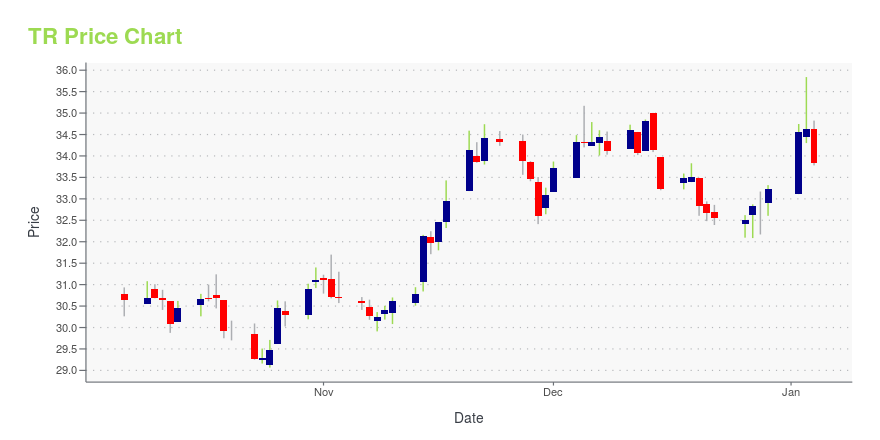
Current price | $44.75 | 52-week high | $46.11 |
Prev. close | $43.60 | 52-week low | $30.14 |
Day low | $43.27 | Volume | 89,378 |
Day high | $44.88 | Avg. volume | 124,810 |
50-day MA | $43.44 | Dividend yield | 0.82% |
200-day MA | $38.45 | Market Cap | 3.15B |
Tootsie Roll Industries, Inc. (TR) Company Bio
Tootsie Roll Industries manufactures and sells confectionery products primarily in the United States, Canada, and Mexico. The company was founded in 1896 and is based in Chicago, Illinois.
Latest TR News From Around the Web
Below are the latest news stories about TOOTSIE ROLL INDUSTRIES INC that investors may wish to consider to help them evaluate TR as an investment opportunity.
Tootsie Roll Industries, Inc.'s (NYSE:TR) Has Performed Well But Fundamentals Look Varied: Is There A Clear Direction For The Stock?Most readers would already know that Tootsie Roll Industries' (NYSE:TR) stock increased by 5.0% over the past three... |
4 Dividend Stocks to Buy for February 2023These dividend stocks are worth a look this month, as the underlying companies get a boost around Valentine's Day. |
Tootsie Roll Industries (NYSE:TR) Ticks All The Boxes When It Comes To Earnings GrowthIt's common for many investors, especially those who are inexperienced, to buy shares in companies with a good story... |
Those who invested in Tootsie Roll Industries (NYSE:TR) five years ago are up 50%When we invest, we're generally looking for stocks that outperform the market average. And the truth is, you can make... |
11 Best Sugar Stocks to Buy NowIn this article, we shall discuss the 11 best sugar stocks to buy now. To skip our detailed analysis of global food and agribusiness trends and the sugar industry, go directly and see 5 Best Sugar Stocks to Buy Now. According to a report by McKinsey and Company, food and agribusiness have an enormous economic and […] |
TR Price Returns
1-mo | 3.26% |
3-mo | 6.13% |
6-mo | 33.63% |
1-year | 34.19% |
3-year | 37.23% |
5-year | 74.10% |
YTD | 8.50% |
2022 | 18.69% |
2021 | 23.31% |
2020 | -9.38% |
2019 | 3.23% |
2018 | -7.18% |
TR Dividends
Ex-Dividend Date | Type | Payout Amount | Change | ||||||
---|---|---|---|---|---|---|---|---|---|
Loading, please wait... |
Continue Researching TR
Want to see what other sources are saying about Tootsie Roll Industries Inc's financials and stock price? Try the links below:Tootsie Roll Industries Inc (TR) Stock Price | Nasdaq
Tootsie Roll Industries Inc (TR) Stock Quote, History and News - Yahoo Finance
Tootsie Roll Industries Inc (TR) Stock Price and Basic Information | MarketWatch
Loading social stream, please wait...