Thomson Reuters Corp. (TRI): Price and Financial Metrics
TRI Price/Volume Stats
Current price | $125.34 | 52-week high | $138.85 |
Prev. close | $128.29 | 52-week low | $97.59 |
Day low | $124.69 | Volume | 465,800 |
Day high | $127.71 | Avg. volume | 411,768 |
50-day MA | $130.17 | Dividend yield | 1.53% |
200-day MA | $125.13 | Market Cap | 57.07B |
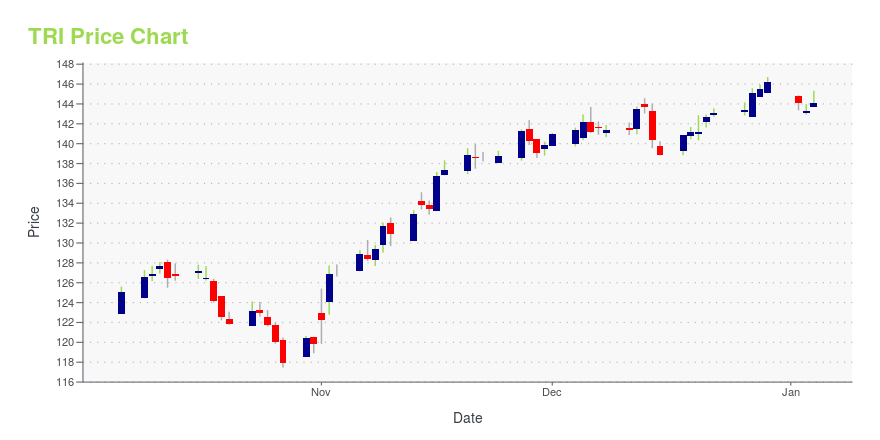
TRI Stock Price Chart Interactive Chart >
TRI POWR Grades
- TRI scores best on the Stability dimension, with a Stability rank ahead of 90.81% of US stocks.
- TRI's strongest trending metric is Growth; it's been moving up over the last 178 days.
- TRI's current lowest rank is in the Momentum metric (where it is better than 21.51% of US stocks).
TRI Stock Summary
- With a market capitalization of $61,128,879,269, THOMSON REUTERS CORP has a greater market value than 96.27% of US stocks.
- TRI's current price/earnings ratio is 56.24, which is higher than 88.79% of US stocks with positive earnings.
- With a price/sales ratio of 9.14, THOMSON REUTERS CORP has a higher such ratio than 87.55% of stocks in our set.
- If you're looking for stocks that are quantitatively similar to THOMSON REUTERS CORP, a group of peers worth examining would be EL, TGT, JCI, HUM, and PGR.
- Visit TRI's SEC page to see the company's official filings. To visit the company's web site, go to www.thomsonreuters.com.
TRI Valuation Summary
- TRI's price/sales ratio is 9; this is 650% higher than that of the median Industrials stock.
- TRI's EV/EBIT ratio has moved up 24.3 over the prior 243 months.
Below are key valuation metrics over time for TRI.
Stock | Date | P/S | P/B | P/E | EV/EBIT |
---|---|---|---|---|---|
TRI | 2023-07-27 | 9.0 | 4.8 | 55.6 | 42.2 |
TRI | 2023-07-26 | 9.0 | 4.8 | 55.6 | 42.2 |
TRI | 2023-07-25 | 9.2 | 4.9 | 56.4 | 42.7 |
TRI | 2023-07-24 | 9.0 | 4.8 | 55.2 | 41.9 |
TRI | 2023-07-21 | 9.0 | 4.8 | 55.2 | 41.9 |
TRI | 2023-07-20 | 9.0 | 4.8 | 55.4 | 42.1 |
TRI Growth Metrics
- Its 4 year revenue growth rate is now at -46.92%.
- The 4 year net cashflow from operations growth rate now stands at -56.63%.
- The 2 year price growth rate now stands at 38.53%.

The table below shows TRI's growth in key financial areas (numbers in millions of US dollars).
Date | Revenue | Operating Cash Flow | Net Income to Common Stock |
---|---|---|---|
2022-12-31 | 6,627 | 1,915 | 1,402 |
2022-09-30 | 6,572 | 1,636 | 945 |
2022-06-30 | 6,524 | 1,639 | 477 |
2022-06-30 | 6,524 | 1,639 | 477 |
2022-03-31 | 6,442 | 1,668 | 1,660 |
2022-03-31 | 6,442 | 1,668 | 1,660 |
TRI's Quality Factors
The “Quality” component of the POWR Ratings focuses on 31 different factors of a companies fundamentals and operational strength. Here are some key insights as we drill into the specifics of these quality attributes.- TRI has a Quality Grade of C, ranking ahead of 25.44% of graded US stocks.
- TRI's asset turnover comes in at 0.28 -- ranking 13th of 14 Printing and Publishing stocks.
- HMHC, JW.A, and DLX are the stocks whose asset turnover ratios are most correlated with TRI.
The table below shows TRI's key quality metrics over time.
Period | Asset Turnover | Gross Margin | ROIC |
---|---|---|---|
2021-09-30 | 0.280 | 1 | 0.752 |
2021-09-30 | 0.280 | 1 | 0.752 |
2021-06-30 | 0.296 | 1 | 0.904 |
2021-06-30 | 0.296 | 1 | 0.904 |
2021-03-31 | 0.320 | 1 | 0.911 |
2021-03-31 | 0.320 | 1 | 0.911 |
TRI Price Target
For more insight on analysts targets of TRI, see our TRI price target page. And for a list of of all stocks sorted by upside potential based on analyst target price, see our Top Price Target page.
Average Price Target | $113.11 | Average Broker Recommendation | 1.88 (Hold) |
Thomson Reuters Corp. (TRI) Company Bio
Thomson Reuters Corporation (/ˈrɔɪtərz/ (listen) ROY-tərz) is a Canadian multinational media conglomerate. The company was founded in Toronto, Ontario, Canada, where it is headquartered at the Bay Adelaide Centre. (Source:Wikipedia)
Latest TRI News From Around the Web
Below are the latest news stories about THOMSON REUTERS CORP that investors may wish to consider to help them evaluate TRI as an investment opportunity.
Thomson Reuters Announces Latest Sale of LSEG SharesThomson Reuters (TSX/NYSE: TRI) announced today that it and certain investment funds affiliated with Blackstone collectively sold 35.0 million London Stock Exchange Group PLC (LSEG) shares that they co-own at a price of £79.50 per share. The sale was conducted through a placement to institutional investors, an offer to retail investors, and includes approximately 9.5 million shares sold directly to LSEG in satisfaction of their previously announced intention to conduct a directed buyback of up t |
FTSE 100: London Stock Exchange Group investors selling £2bn stake in secondary share offerLondon Stock Exchange Group investors including Thomson Reuters, the US private equity giant Blackstone, Canada's CPPIB and Singapore's GIC are all selling shares. |
New AI products focus legal minds on privacy — and costsAmid a flurry of launches and upgrades, many law firms remain hesitant about how and when to join in |
UPDATE 2-LSEG investors Thomson Reuters, Blackstone to sell $2.9 bln shares in bourse operatorInvestors in the London Stock Exchange Group, including Blackstone and Thomson Reuters , are launching a sale of roughly 28.3 million shares worth about 2.3 billion pounds ($2.9 billion), bookrunners for the deal said on Wednesday. This follows a sale in May of about $3.4 billion shares in the bourse operator as the investor group seeks to offload its stake in LSEG. The consortium, which includes Canada's CPPIB and Singapore's GIC, aims to sell a total of about 43.1 million shares over time in LSEG through the offering, a directed buyback and a sale of call options, bookrunners said. |
David W. Binet to Resign from Thomson Reuters Board of DirectorsThomson Reuters Corporation ("Thomson Reuters") (NYSE / TSX: TRI) announced today that David Binet, 66, has communicated to the Board his intention to resign from the Board of Directors effective at the next regularly scheduled Board meeting on September 19. |
TRI Price Returns
1-mo | -1.76% |
3-mo | -5.83% |
6-mo | -0.63% |
1-year | 21.59% |
3-year | 67.66% |
5-year | 204.76% |
YTD | 11.65% |
2022 | -3.01% |
2021 | 47.08% |
2020 | 16.71% |
2019 | 51.59% |
2018 | 15.52% |
TRI Dividends
Ex-Dividend Date | Type | Payout Amount | Change | ||||||
---|---|---|---|---|---|---|---|---|---|
Loading, please wait... |
Continue Researching TRI
Want to do more research on Thomson Reuters Corp's stock and its price? Try the links below:Thomson Reuters Corp (TRI) Stock Price | Nasdaq
Thomson Reuters Corp (TRI) Stock Quote, History and News - Yahoo Finance
Thomson Reuters Corp (TRI) Stock Price and Basic Information | MarketWatch
Loading social stream, please wait...