
Trinity Industries, Inc. (TRN): Price and Financial Metrics
TRN Price/Volume Stats
| Current price | $33.32 | 52-week high | $34.24 |
| Prev. close | $33.28 | 52-week low | $20.04 |
| Day low | $33.12 | Volume | 491,044 |
| Day high | $34.24 | Avg. volume | 553,883 |
| 50-day MA | $30.34 | Dividend yield | 3.43% |
| 200-day MA | $26.85 | Market Cap | 2.73B |
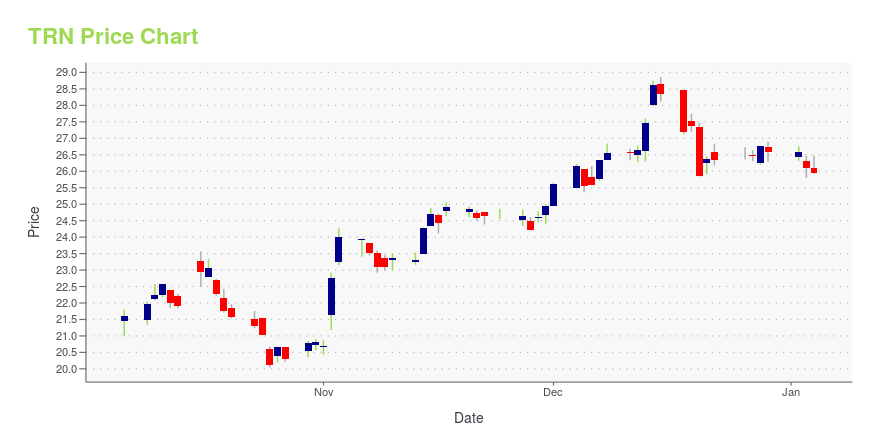
TRN Stock Price Chart Interactive Chart >
Trinity Industries, Inc. (TRN) Company Bio
Trinity Industries, Inc. provides various products and services for the energy, transportation, chemical, and construction sectors in the United States and internationally. Its Rail Group segment offers railcars, including autorack, box, covered hopper, gondola, intermodal, tank, and open hopper cars; and couplers, axles, and other equipment, as well as railcar maintenance services. The company was founded in 1933 and is based in Dallas, Texas.
Latest TRN News From Around the Web
Below are the latest news stories about TRINITY INDUSTRIES INC that investors may wish to consider to help them evaluate TRN as an investment opportunity.
Dividends Aid Trinity (TRN) Amid Labor & Supply-Chain WoesWhile rising demand for railcars and shareholder-friendly initiatives aid Trinity (TRN), supply-chain disruptions and labor shortages are weighing on its operations. |
Trinity Industries (NYSE:TRN) Is Increasing Its Dividend To $0.28Trinity Industries, Inc. ( NYSE:TRN ) has announced that it will be increasing its periodic dividend on the 31st of... |
Trinity (TRN) Rewards Shareholders With 8% Dividend HikeTrinity (TRN) shareholder-friendly initiatives are expected to boost investors' confidence and positively impact the company's bottom line. |
Trinity Industries, Inc. Increases Quarterly Dividend to $0.28 / ShareDALLAS, December 06, 2023--Trinity Industries, Inc. (NYSE:TRN) has declared an increase in its quarterly dividend to 28 cents per share on its $0.01 par value common stock. The new dividend reflects an increase of approximately 8% compared to the most recent quarterly dividend of 26 cents per share and reflects a continued commitment to dividend growth. The quarterly cash dividend, representing Trinity’s 239th consecutively paid dividend, is payable January 31, 2024 to stockholders of record on |
Three for Four: 3 Dividend Stocks With Over 4% YieldsIf you look, you can still find quality, leading companies out there with high dividend yields well above 4% -- far more than the measly average offering of the S&P 500 stocks. Flowers Foods opened its first bakery in 1919 and has since become one of the largest producers of packaged bakery foods in the United States, operating 46 bakeries in 18 states. Well-known brands include Wonder Bread, Home Pride, Nature's Own, Dave's Killer Bread, Tastykake and Canyon Bakehouse. |
TRN Price Returns
| 1-mo | 13.34% |
| 3-mo | 23.95% |
| 6-mo | 31.36% |
| 1-year | 35.31% |
| 3-year | 41.21% |
| 5-year | 116.44% |
| YTD | 29.23% |
| 2023 | -6.24% |
| 2022 | 1.48% |
| 2021 | 17.93% |
| 2020 | 23.82% |
| 2019 | 11.09% |
TRN Dividends
| Ex-Dividend Date | Type | Payout Amount | Change | ||||||
|---|---|---|---|---|---|---|---|---|---|
| Loading, please wait... | |||||||||
Continue Researching TRN
Want to do more research on Trinity Industries Inc's stock and its price? Try the links below:Trinity Industries Inc (TRN) Stock Price | Nasdaq
Trinity Industries Inc (TRN) Stock Quote, History and News - Yahoo Finance
Trinity Industries Inc (TRN) Stock Price and Basic Information | MarketWatch
Loading social stream, please wait...