Terreno Realty Corporation (TRNO): Price and Financial Metrics

Terreno Realty Corporation (TRNO): $61.76

-0.55 (-0.88%)

POWR Rating

Component Grades

Momentum

C

Stability

C

Sentiment

Quality

C

Add TRNO to Watchlist
Sign Up

Industry: REITs - Industrial

Industry

F

Ranked

#14 of 18

in industry

TRNO Price/Volume Stats

Current price $61.76 52-week high $67.03
Prev. close $62.31 52-week low $50.36
Day low $61.08 Volume 65,408
Day high $62.07 Avg. volume 540,390
50-day MA $61.94 Dividend yield 2.6%
200-day MA $59.92 Market Cap 5.14B

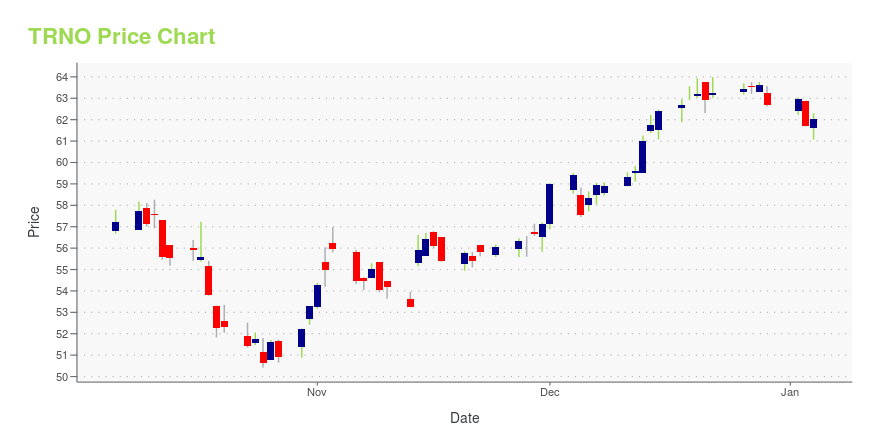
TRNO Stock Price Chart Interactive Chart >

TRNO POWR Grades

  • TRNO scores best on the Stability dimension, with a Stability rank ahead of 62.02% of US stocks.
  • The strongest trend for TRNO is in Momentum, which has been heading down over the past 179 days.
  • TRNO's current lowest rank is in the Value metric (where it is better than 6.48% of US stocks).

TRNO Stock Summary

  • For TRNO, its debt to operating expenses ratio is greater than that reported by 88.13% of US equities we're observing.
  • With a price/sales ratio of 17.19, TERRENO REALTY CORP has a higher such ratio than 93.59% of stocks in our set.
  • In terms of volatility of its share price, TRNO is more volatile than merely 8.23% of stocks we're observing.
  • If you're looking for stocks that are quantitatively similar to TERRENO REALTY CORP, a group of peers worth examining would be UBA, REXR, JBGS, VAL, and SKT.
  • TRNO's SEC filings can be seen here. And to visit TERRENO REALTY CORP's official web site, go to www.terreno.com.

TRNO Valuation Summary

  • In comparison to the median Real Estate stock, TRNO's price/sales ratio is 1536.36% higher, now standing at 18.
  • Over the past 161 months, TRNO's EV/EBIT ratio has gone NA NA.

Below are key valuation metrics over time for TRNO.

Stock Date P/S P/B P/E EV/EBIT
TRNO 2023-05-11 18.0 2 25.7 26.0
TRNO 2023-05-10 18.2 2 26.0 26.2
TRNO 2023-05-09 18.0 2 25.7 26.0
TRNO 2023-05-08 18.0 2 25.7 26.0
TRNO 2023-05-05 18.1 2 25.8 26.1
TRNO 2023-05-04 17.9 2 25.6 25.9

TRNO Growth Metrics

    Its 5 year net cashflow from operations growth rate is now at 71.03%.
  • Its 3 year revenue growth rate is now at 51.37%.
  • Its 2 year price growth rate is now at 33.58%.
Over the past 34 months, TRNO's revenue has gone up $100,954,000.

The table below shows TRNO's growth in key financial areas (numbers in millions of US dollars).

Date Revenue Operating Cash Flow Net Income to Common Stock
2022-12-31 276.212 143.21 197.16
2022-09-30 260.88 142.786 170.703
2022-06-30 247.348 136.211 169.644
2022-03-31 235.274 134.086 90.318
2021-12-31 221.93 132.208 86.943
2021-09-30 210.134 122.122 68.194

TRNO's Quality Factors

The “Quality” component of the POWR Ratings focuses on 31 different factors of a companies fundamentals and operational strength. Here are some key insights as we drill into the specifics of these quality attributes.
  • TRNO has a Quality Grade of C, ranking ahead of 43.25% of graded US stocks.
  • TRNO's asset turnover comes in at 0.092 -- ranking 42nd of 63 Real Estate stocks.
  • RLGY, EFC, and BOMN are the stocks whose asset turnover ratios are most correlated with TRNO.

The table below shows TRNO's key quality metrics over time.

Period Asset Turnover Gross Margin ROIC
2021-06-30 0.092 0.740 0.034
2021-03-31 0.090 0.737 0.040
2020-12-31 0.088 0.737 0.039
2020-09-30 0.086 0.738 0.040
2020-06-30 0.086 0.740 0.036
2020-03-31 0.085 0.741 0.029

Terreno Realty Corporation (TRNO) Company Bio


Terreno Realty Corporation is an acquirer, owner and operator of industrial real estate in six major coastal U.S. markets: Los Angeles; Northern New Jersey/New York City; San Francisco Bay Area; Seattle; Miami; and Washington, D.C./Baltimore. The company was founded in 2009 and is based in San Francisco, California.


TRNO Latest News Stream


Event/Time News Detail
Loading, please wait...

TRNO Latest Social Stream


Loading social stream, please wait...

View Full TRNO Social Stream

Latest TRNO News From Around the Web

Below are the latest news stories about TERRENO REALTY CORP that investors may wish to consider to help them evaluate TRNO as an investment opportunity.

Terreno (TRNO) Executes Early Lease Renewal for Kent Property

Terreno's (TRNO) latest leasing and renewal activity reflects the solid demand for its properties amid the industrial real estate sector's healthy fundamentals.

Yahoo | May 31, 2023

Terreno Realty Corporation Announces Lease in Kent, WA

BELLEVUE, Wash., May 30, 2023--Terreno Realty Corporation Announces Lease in Kent, WA

Yahoo | May 30, 2023

Terreno (TRNO) Sees Solid Demand, Leases Long Island City Asset

Terreno's (TRNO) latest leasing activity reflects the solid demand for its properties amid the industrial real estate sector's healthy fundamentals.

Yahoo | May 26, 2023

Terreno Realty Corporation Announces Lease in Queens, NY

BELLEVUE, Wash., May 25, 2023--Terreno Realty Corporation Announces Lease in Queens, NY

Yahoo | May 25, 2023

Terreno (TRNO) Boosts Portfolio With Washington, D.C. Property

Terreno's (TRNO) recent spate of acquisitions of industrial properties is likely to aid it in riding solid industrial real estate market tailwinds.

Yahoo | May 25, 2023

Read More 'TRNO' Stories Here

TRNO Price Returns

1-mo -0.27%
3-mo 3.54%
6-mo 9.69%
1-year 4.69%
3-year 23.10%
5-year 81.83%
YTD 9.29%
2022 -31.61%
2021 48.55%
2020 10.42%
2019 57.19%
2018 2.87%

TRNO Dividends

Ex-Dividend Date Type Payout Amount Change
Loading, please wait...
View Full TRNO Dividend History

Continue Researching TRNO

Want to see what other sources are saying about Terreno Realty Corp's financials and stock price? Try the links below:

Terreno Realty Corp (TRNO) Stock Price | Nasdaq
Terreno Realty Corp (TRNO) Stock Quote, History and News - Yahoo Finance
Terreno Realty Corp (TRNO) Stock Price and Basic Information | MarketWatch

Get Free Updates

Join thousands of investors who get the latest news, insights and top rated picks from StockNews.com!