T. Rowe Price Group Inc. (TROW): Price and Financial Metrics

T. Rowe Price Group Inc. (TROW): $111.38

0.46 (+0.41%)

POWR Rating

Component Grades

Momentum

A

Stability

C

Sentiment

Quality

B

Add TROW to Watchlist
Sign Up

Industry: Asset Management

Industry

D

Ranked

#27 of 54

in industry

TROW Price/Volume Stats

Current price $111.38 52-week high $134.64
Prev. close $110.92 52-week low $93.53
Day low $109.04 Volume 420,251
Day high $111.65 Avg. volume 1,570,065
50-day MA $108.97 Dividend yield 4.5%
200-day MA $113.12 Market Cap 25.01B

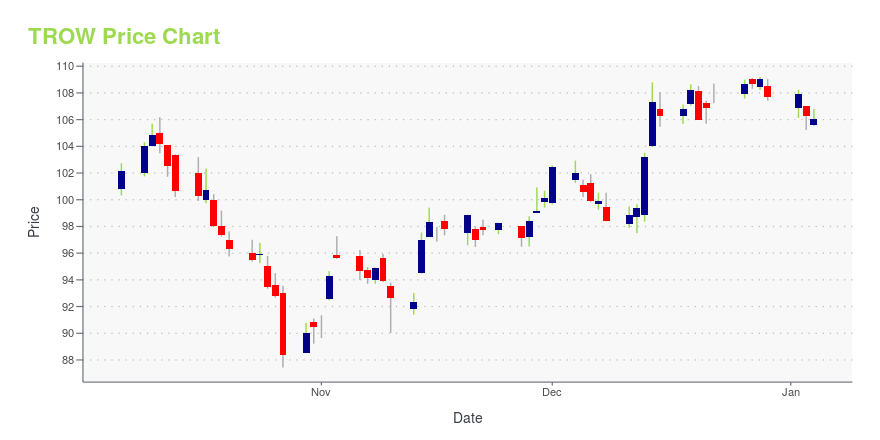
TROW Stock Price Chart Interactive Chart >

TROW POWR Grades

  • TROW scores best on the Momentum dimension, with a Momentum rank ahead of 91.64% of US stocks.
  • The strongest trend for TROW is in Value, which has been heading down over the past 179 days.
  • TROW's current lowest rank is in the Sentiment metric (where it is better than 2.37% of US stocks).

TROW Stock Summary

  • PRICE T ROWE GROUP INC's market capitalization of $23,310,572,251 is ahead of 91.1% of US-listed equities.
  • TROW's went public 34.43 years ago, making it older than 90.16% of listed US stocks we're tracking.
  • The volatility of PRICE T ROWE GROUP INC's share price is greater than that of merely 9.25% US stocks with at least 200 days of trading history.
  • Stocks with similar financial metrics, market capitalization, and price volatility to PRICE T ROWE GROUP INC are TW, NE, IIPR, HIVE, and PED.
  • TROW's SEC filings can be seen here. And to visit PRICE T ROWE GROUP INC's official web site, go to www.troweprice.com.

TROW Valuation Summary

  • In comparison to the median Financial Services stock, TROW's price/sales ratio is 77.27% higher, now standing at 3.9.
  • TROW's price/sales ratio has moved down 0.6 over the prior 243 months.

Below are key valuation metrics over time for TROW.

Stock Date P/S P/B P/E EV/EBIT
TROW 2023-05-19 3.9 2.6 17.0 11.5
TROW 2023-05-18 3.9 2.7 17.1 11.7
TROW 2023-05-17 3.8 2.6 16.8 11.4
TROW 2023-05-16 3.8 2.6 16.6 11.2
TROW 2023-05-15 3.9 2.6 16.9 11.5
TROW 2023-05-12 3.8 2.6 16.8 11.4

TROW Growth Metrics

    Its 4 year net cashflow from operations growth rate is now at 486.22%.
  • Its 4 year revenue growth rate is now at 32.49%.
  • The year over year net income to common stockholders growth rate now stands at 4.4%.
TROW's revenue has moved up $735,200,000 over the prior 34 months.

The table below shows TROW's growth in key financial areas (numbers in millions of US dollars).

Date Revenue Operating Cash Flow Net Income to Common Stock
2022-12-31 6,488.4 2,359.4 1,557.9
2022-09-30 6,925.9 2,855.9 2,032.5
2022-06-30 7,291.8 3,377 2,425.3
2022-03-31 7,708.1 3,560.7 2,901.4
2021-12-31 7,671.9 3,452 3,082.9
2021-09-30 7,443.1 3,092.7 3,125.7

TROW's Quality Factors

The “Quality” component of the POWR Ratings focuses on 31 different factors of a companies fundamentals and operational strength. Here are some key insights as we drill into the specifics of these quality attributes.
  • TROW has a Quality Grade of B, ranking ahead of 87.46% of graded US stocks.
  • TROW's asset turnover comes in at 0.674 -- ranking 28th of 444 Trading stocks.
  • CHMI, NTIP, and MN are the stocks whose asset turnover ratios are most correlated with TROW.

The table below shows TROW's key quality metrics over time.

Period Asset Turnover Gross Margin ROIC
2021-09-30 0.674 0.631 0.538
2021-06-30 0.662 0.618 0.522
2021-03-31 0.641 0.601 0.496
2020-12-31 0.638 0.604 0.428
2020-09-30 0.633 0.606 0.400
2020-06-30 0.627 0.611 0.387

TROW Price Target

For more insight on analysts targets of TROW, see our TROW price target page. And for a list of of all stocks sorted by upside potential based on analyst target price, see our Top Price Target page.

Average Price Target $204.40 Average Broker Recommendation 2 (Hold)

T. Rowe Price Group Inc. (TROW) Company Bio


T. Rowe Price Group, Inc. is an American publicly owned global investment management firm that offers funds, advisory services, account management, and retirement plans and services for individuals, institutions, and financial intermediaries. The firm has assets under management of more than $1.6 trillion and annual revenues of $6.2 billion as of 2020, placing it 447 on the Fortune 500 list of the largest U.S. companies. Headquartered at 100 East Pratt Street in Baltimore, Maryland, it has 5,000 employees in Baltimore and 16 international offices serve clients in 47 countries around the world. (Source:Wikipedia)


TROW Latest News Stream


Event/Time News Detail
Loading, please wait...

TROW Latest Social Stream


Loading social stream, please wait...

View Full TROW Social Stream

Latest TROW News From Around the Web

Below are the latest news stories about PRICE T ROWE GROUP INC that investors may wish to consider to help them evaluate TROW as an investment opportunity.

5 Investors Betting Big on MongoDB (MDB) Stock Now

Shares of MDB stock are surging on the back of strong earnings, leading to big profits for these institutional investors.

Chris MacDonald on InvestorPlace | June 2, 2023

Should You Consider T. Rowe Price (TROW) for Its Dividend?

T. Rowe Price (TROW) is benefiting from organic growth on the back of solid AUM balance and enhancing investment capabilities. This makes the stock a solid dividend-yielding pick for investors amid recession fears.

Yahoo | June 2, 2023

The 10 Best T. Rowe Price Mutual Funds To Buy Now

T. Rowe Price is a renowned name in the investment industry, offering a wide range of mutual funds designed to meet diverse investment objectives. With a history dating back to 1937, T. Rowe Price has established a reputation for delivering consistent returns and prudent investment management.

Yahoo | May 31, 2023

T. Rowe Price adding five more ETFs as demand for funds grows

Unlike other institutional investors, T. Rowe Price is leaning into actively managed ETFs, a space the company's global head of ETFs said could grow to be a multi-trillion dollar industry.

Yahoo | May 30, 2023

Is This High-Yield Stock a Buy for Passive Income?

Stubborn inflation well above the Federal Reserve's 2% target, elevated interest rates, and slowing economic activity are all warning signs of a potential recession in 2023. With a potential recession on the way, investors often adjust their portfolio strategies to prepare. When done right, dividend growth investing has proven itself to be a durable strategy no matter the economic environment.

Yahoo | May 23, 2023

Read More 'TROW' Stories Here

TROW Price Returns

1-mo 3.64%
3-mo 1.26%
6-mo -6.13%
1-year -7.00%
3-year -3.01%
5-year 4.33%
YTD 3.31%
2022 -42.24%
2021 34.91%
2020 28.11%
2019 35.61%
2018 -9.75%

TROW Dividends

Ex-Dividend Date Type Payout Amount Change
Loading, please wait...
View Full TROW Dividend History

Continue Researching TROW

Here are a few links from around the web to help you further your research on Price T Rowe Group Inc's stock as an investment opportunity:

Price T Rowe Group Inc (TROW) Stock Price | Nasdaq
Price T Rowe Group Inc (TROW) Stock Quote, History and News - Yahoo Finance
Price T Rowe Group Inc (TROW) Stock Price and Basic Information | MarketWatch

Get Free Updates

Join thousands of investors who get the latest news, insights and top rated picks from StockNews.com!