
TransUnion (TRU): Price and Financial Metrics
TRU Price/Volume Stats
| Current price | $86.46 | 52-week high | $87.36 |
| Prev. close | $83.81 | 52-week low | $42.09 |
| Day low | $84.61 | Volume | 2,781,152 |
| Day high | $87.36 | Avg. volume | 1,615,900 |
| 50-day MA | $75.89 | Dividend yield | 0.53% |
| 200-day MA | $70.39 | Market Cap | 16.79B |
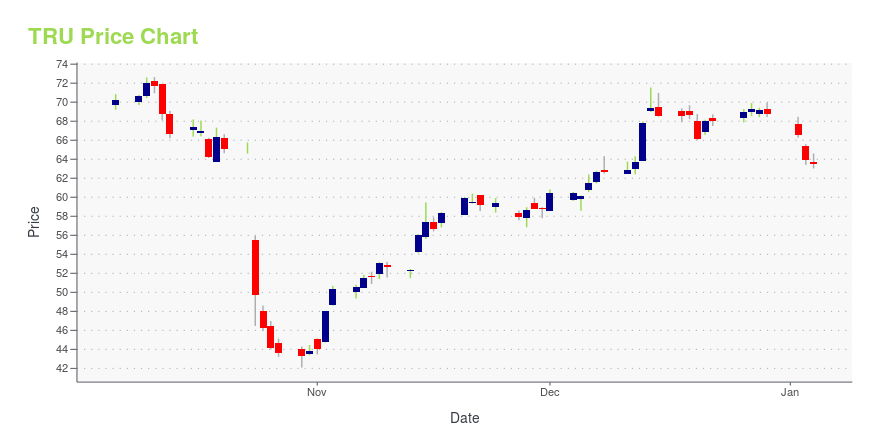
TRU Stock Price Chart Interactive Chart >
TransUnion (TRU) Company Bio
TransUnion is an American consumer credit reporting agency. TransUnion collects and aggregates information on over one billion individual consumers in over thirty countries including "200 million files profiling nearly every credit-active consumer in the United States". Its customers include over 65,000 businesses. Based in Chicago, Illinois, TransUnion's 2014 revenue was US$1.3 billion. It is the smallest of the three largest credit agencies, along with Experian and Equifax (known as the "Big Three"). (Source:Wikipedia)
Latest TRU News From Around the Web
Below are the latest news stories about TRANSUNION that investors may wish to consider to help them evaluate TRU as an investment opportunity.
Analyst Favorites: 3 Newly Rated ‘Buy’ Stocks to Consider NowThe top analyst stock picks heading into 2024 include these three names that analysts have recently initiated coverage with a "Buy". |
Is There Now An Opportunity In TransUnion (NYSE:TRU)?Let's talk about the popular TransUnion ( NYSE:TRU ). The company's shares received a lot of attention from a... |
Up to One in Four Consumers Experience Fraud Attempts Via Mobile Devices Multiple Times Per Week or DailyTransUnion report finds consumers want specific fraud protections from mobile service providersCHICAGO, Dec. 14, 2023 (GLOBE NEWSWIRE) -- “Who’s calling now?” has become a ubiquitous question and a sign of the times for mobile users as fraud and spammers repeatedly target consumers through their phones. New research from TransUnion (NYSE:TRU) reveals that around one-third of consumers experience fraud attempts multiple times per week, if not daily. More than half (51%) report being targeted in t |
Rocketer and TransUnion Announce Data Collaboration to Maximize High-Quality Customers for Insurance ProvidersRocketer Powered By TruAudience drove conversions that generated an average of $265 in additional revenue per user, leading to an overall 363% increase in revenue per month for a US-based life insurance companyLONDON and CHICAGO, Dec. 12, 2023 (GLOBE NEWSWIRE) -- Rocketer, a performance marketing company with proprietary media delivery technology, and TransUnion (NYSE: TRU), today announced the launch of Rocketer Powered By TruAudience, a data collaboration designed to supercharge how insurance |
Canadians Increase E-Commerce Activity During Black Friday Shopping Period Despite 80% Concerned about Falling Victim to Online Fraud Over Holidays – TransUnion studyTransUnion study also reveals 4.5% increase in suspected fraud rate in Canada from the same period in 2022. Key Findings: 80% of Canadians surveyed are concerned about falling victim to online fraud during the 2023 holiday season.70% are concerned about sharing personal information.Phishing (44%), smishing (37%) and vishing (35%) were the top three reported fraud schemes among those who said they were targeted with fraud over the last three months.More than 1 in 5 Canadians (22%) worry about sha |
TRU Price Returns
| 1-mo | 17.33% |
| 3-mo | 16.22% |
| 6-mo | 28.07% |
| 1-year | 9.51% |
| 3-year | -25.70% |
| 5-year | 4.95% |
| YTD | 26.17% |
| 2023 | 21.85% |
| 2022 | -51.90% |
| 2021 | 19.91% |
| 2020 | 16.30% |
| 2019 | 51.34% |
TRU Dividends
| Ex-Dividend Date | Type | Payout Amount | Change | ||||||
|---|---|---|---|---|---|---|---|---|---|
| Loading, please wait... | |||||||||
Continue Researching TRU
Here are a few links from around the web to help you further your research on TransUnion's stock as an investment opportunity:TransUnion (TRU) Stock Price | Nasdaq
TransUnion (TRU) Stock Quote, History and News - Yahoo Finance
TransUnion (TRU) Stock Price and Basic Information | MarketWatch
Loading social stream, please wait...