TrueCar, Inc. (TRUE): Price and Financial Metrics
TRUE Price/Volume Stats
Current price | $2.07 | 52-week high | $3.49 |
Prev. close | $2.10 | 52-week low | $1.30 |
Day low | $2.06 | Volume | 186,800 |
Day high | $2.19 | Avg. volume | 269,551 |
50-day MA | $2.30 | Dividend yield | N/A |
200-day MA | $2.44 | Market Cap | 186.43M |
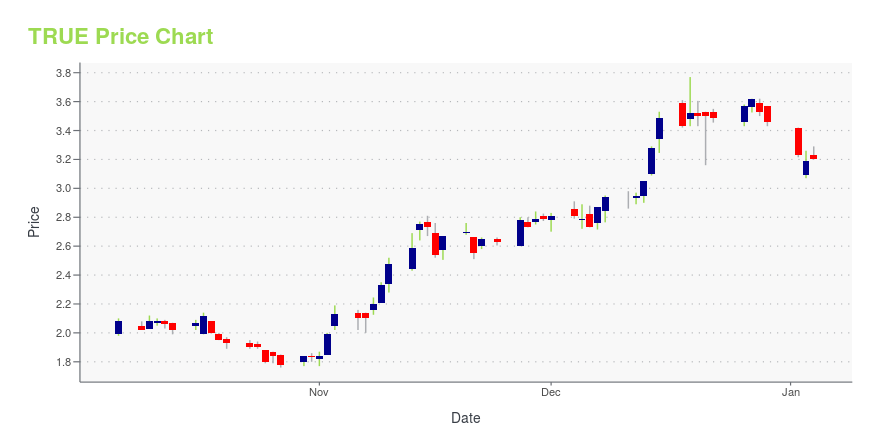
TRUE Stock Price Chart Interactive Chart >
TRUE POWR Grades
- Sentiment is the dimension where TRUE ranks best; there it ranks ahead of 91.39% of US stocks.
- The strongest trend for TRUE is in Growth, which has been heading up over the past 177 days.
- TRUE ranks lowest in Momentum; there it ranks in the 32nd percentile.
TRUE Stock Summary
- The ratio of debt to operating expenses for TRUECAR INC is higher than it is for about just 12.7% of US stocks.
- In terms of twelve month growth in earnings before interest and taxes, TRUECAR INC is reporting a growth rate of 178.34%; that's higher than 92.54% of US stocks.
- Revenue growth over the past 12 months for TRUECAR INC comes in at -18.56%, a number that bests merely 13.37% of the US stocks we're tracking.
- Stocks with similar financial metrics, market capitalization, and price volatility to TRUECAR INC are TWOU, EVCM, CARS, GNSS, and QDEL.
- Visit TRUE's SEC page to see the company's official filings. To visit the company's web site, go to www.truecar.com.
TRUE Valuation Summary
- TRUE's EV/EBIT ratio is -0.7; this is 104.7% lower than that of the median Communication Services stock.
- Over the past 114 months, TRUE's price/sales ratio has gone down 3.3.
Below are key valuation metrics over time for TRUE.
Stock | Date | P/S | P/B | P/E | EV/EBIT |
---|---|---|---|---|---|
TRUE | 2023-09-21 | 1.4 | 1.3 | -1.6 | -0.7 |
TRUE | 2023-09-20 | 1.4 | 1.3 | -1.6 | -0.7 |
TRUE | 2023-09-19 | 1.4 | 1.3 | -1.6 | -0.7 |
TRUE | 2023-09-18 | 1.4 | 1.3 | -1.6 | -0.7 |
TRUE | 2023-09-15 | 1.4 | 1.3 | -1.6 | -0.7 |
TRUE | 2023-09-14 | 1.4 | 1.3 | -1.6 | -0.7 |
TRUE Growth Metrics
- Its 4 year revenue growth rate is now at 20.73%.
- The year over year net cashflow from operations growth rate now stands at -96.8%.
- The 4 year net cashflow from operations growth rate now stands at 121.31%.

The table below shows TRUE's growth in key financial areas (numbers in millions of US dollars).
Date | Revenue | Operating Cash Flow | Net Income to Common Stock |
---|---|---|---|
2022-12-31 | 161.524 | -29.137 | -118.685 |
2022-09-30 | 170.721 | -22.015 | -116.338 |
2022-06-30 | 186.635 | -14.344 | -46.061 |
2022-03-31 | 210.126 | 1.25 | -42.325 |
2021-12-31 | 231.698 | 14.194 | -38.329 |
2021-09-30 | 249.797 | 31.42 | 64.329 |
TRUE's Quality Factors
The “Quality” component of the POWR Ratings focuses on 31 different factors of a companies fundamentals and operational strength. Here are some key insights as we drill into the specifics of these quality attributes.- TRUE has a Quality Grade of B, ranking ahead of 94.29% of graded US stocks.
- TRUE's asset turnover comes in at 0.63 -- ranking 256th of 563 Business Services stocks.
- ISSC, INUV, and VVI are the stocks whose asset turnover ratios are most correlated with TRUE.
The table below shows TRUE's key quality metrics over time.
Period | Asset Turnover | Gross Margin | ROIC |
---|---|---|---|
2021-06-30 | 0.630 | 0.923 | 0.688 |
2021-03-31 | 0.637 | 0.918 | 0.600 |
2020-12-31 | 0.676 | 0.923 | 0.545 |
2020-09-30 | 0.777 | 0.915 | -0.134 |
2020-06-30 | 0.785 | 0.907 | -0.270 |
2020-03-31 | 0.812 | 0.910 | -0.354 |
TRUE Price Target
For more insight on analysts targets of TRUE, see our TRUE price target page. And for a list of of all stocks sorted by upside potential based on analyst target price, see our Top Price Target page.
Average Price Target | $6.18 | Average Broker Recommendation | 1.75 (Moderate Buy) |
TrueCar, Inc. (TRUE) Company Bio
TrueCar Inc. enables users to obtain market-based pricing data on new and used cars, and to connect with its network of TrueCar Certified Dealers. The company was founded in 2005 and is based in Santa Monica, California.
Latest TRUE News From Around the Web
Below are the latest news stories about TRUECAR INC that investors may wish to consider to help them evaluate TRUE as an investment opportunity.
Car Sales Are Slowing. Car-Listing Websites Are Just Getting Started.Auto retail is finally shifting from a seller’s market to a buyer’s market: Dealers’ car lots are looking fuller, while high interest rates are making consumers choosier. CarGurus and Cars.com are among the largest online platforms that consumers use to shop for cars. Dealers and car manufacturers can also pay for advertising slots and additional features their potential customers might value, such as online appraisals and loan screening. |
TrueCar Announces New Leadership AppointmentsTrueCar, Inc., (NASDAQ:TRUE), the easiest, most efficient and transparent online destination for buying and selling new and used vehicles, today announced new leadership appointments and role changes. Oliver Foley is joining TrueCar as Chief Financial Officer, replacing Teresa Luong. Jay Ku will be shifting roles from Chief Commerce Officer which he took on in February 2023, to Chief Revenue Officer. Lisa Hess is promoted to Head of Sales. |
Deep Discounts on New Mercedes Benz CarsGet up to $10,750 off a Mercedes from American Express and Sam’s Club. You can drive into the sunset in a new Mercedes if you are a current American Express credit card holder or a member of Sam’s Club. The maximum discount of $10,750 applies only to a car that costs over $100,000, leaving us mere mortals in the dust. But more mainstream Mercedes SUVs and sedans can get between $500 and $4,500 off. Active military servicemembers and PenFed credit union members may also tap into these discounts. |
Here's Why We're Not Too Worried About TrueCar's (NASDAQ:TRUE) Cash Burn SituationEven when a business is losing money, it's possible for shareholders to make money if they buy a good business at the... |
TrueCar Inc's Rocky Road Ahead: Unraveling the Factors Limiting OutperformanceDecoding the GF Score and Its Implications for TrueCar Inc's Future Performance |
TRUE Price Returns
1-mo | -15.85% |
3-mo | -9.21% |
6-mo | -9.21% |
1-year | 37.09% |
3-year | -59.73% |
5-year | -84.46% |
YTD | -17.53% |
2022 | -26.18% |
2021 | -19.05% |
2020 | -11.58% |
2019 | -47.57% |
2018 | -19.11% |
Continue Researching TRUE
Want to see what other sources are saying about TrueCar Inc's financials and stock price? Try the links below:TrueCar Inc (TRUE) Stock Price | Nasdaq
TrueCar Inc (TRUE) Stock Quote, History and News - Yahoo Finance
TrueCar Inc (TRUE) Stock Price and Basic Information | MarketWatch
Loading social stream, please wait...