
Travelers Cos. Inc. (TRV): Price and Financial Metrics
TRV Price/Volume Stats
| Current price | $213.85 | 52-week high | $232.75 |
| Prev. close | $209.23 | 52-week low | $157.33 |
| Day low | $210.36 | Volume | 1,220,457 |
| Day high | $214.97 | Avg. volume | 1,378,479 |
| 50-day MA | $210.24 | Dividend yield | 2.01% |
| 200-day MA | $202.38 | Market Cap | 48.97B |
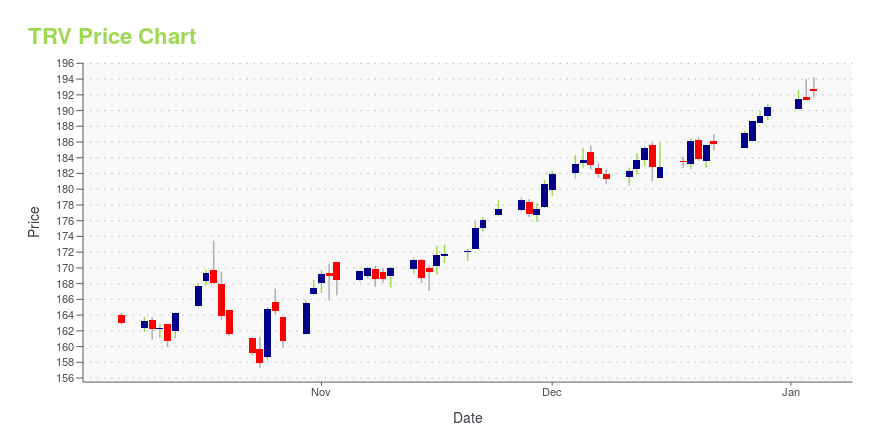
TRV Stock Price Chart Interactive Chart >
Travelers Cos. Inc. (TRV) Company Bio
The Travelers Companies, Inc., commonly known as Travelers, is an American insurance company. It is the second-largest writer of U.S. commercial property casualty insurance, and the sixth-largest writer of U.S. personal insurance through independent agents. Travelers is incorporated in Minnesota, with headquarters in New York City, and its largest office in Hartford, Connecticut. It has been a component of the Dow Jones Industrial Average since June 8, 2009. (Source:Wikipedia)
Latest TRV News From Around the Web
Below are the latest news stories about TRAVELERS COMPANIES INC that investors may wish to consider to help them evaluate TRV as an investment opportunity.
Should You Add Travelers The Travelers Companies (TRV)?ClearBridge Investments, an investment management company, released its “ClearBridge Sustainability Leaders Strategy” third quarter 2023 investor letter. A copy of the same can be downloaded here. The strategy underperformed its benchmark, the Russell 3000 Index, in the quarter. The strategy gained two out of 10 sectors in which it invested during the quarter, on an absolute […] |
15 Best Auto Insurance Companies Heading into 2024In this article, we will look at the 15 best auto insurance companies heading into 2024. If you want to skip our detailed analysis of the auto insurance market, you can go directly to 5 Best Auto Insurance Companies Heading into 2024. Global Auto Insurance Industry Poised for Growth The auto insurance industry is a […] |
15 Best Term Life Insurance Companies Heading into 2024In this article, we will look into the 15 best term life insurance companies heading into 2024. If you want to skip our detailed analysis, you can go directly to 5 Best Term Life Insurance Companies Heading into 2024. Term Life Insurance Industry: A Market Analysis According to a report by Grand View Research, the […] |
15 Best Earthquake Insurance Companies Heading into 2024In this article, we will look into the 15 best earthquake insurance companies heading into 2024. If you want to skip our detailed analysis, you can go directly to the 5 Best Earthquake Insurance Companies Heading into 2024. Why Do You Need Earthquake Insurance? Earthquake insurance covers both life and non-life insurance, depending on the […] |
7 Low-Volatility Stocks for Stable Growth in 2024Wager on these stocks to buy for stable growth, handpicked for their low volatility and potential to weather economic headwinds. |
TRV Price Returns
| 1-mo | 3.94% |
| 3-mo | 0.68% |
| 6-mo | 2.11% |
| 1-year | 24.91% |
| 3-year | 52.72% |
| 5-year | 59.89% |
| YTD | 13.33% |
| 2023 | 3.93% |
| 2022 | 22.42% |
| 2021 | 13.96% |
| 2020 | 5.31% |
| 2019 | 17.00% |
TRV Dividends
| Ex-Dividend Date | Type | Payout Amount | Change | ||||||
|---|---|---|---|---|---|---|---|---|---|
| Loading, please wait... | |||||||||
Continue Researching TRV
Want to see what other sources are saying about Travelers Companies Inc's financials and stock price? Try the links below:Travelers Companies Inc (TRV) Stock Price | Nasdaq
Travelers Companies Inc (TRV) Stock Quote, History and News - Yahoo Finance
Travelers Companies Inc (TRV) Stock Price and Basic Information | MarketWatch
Loading social stream, please wait...