Townsquare Media, Inc. (TSQ): Price and Financial Metrics
TSQ Price/Volume Stats
Current price | $10.60 | 52-week high | $11.00 |
Prev. close | $10.78 | 52-week low | $7.05 |
Day low | $10.51 | Volume | 43,100 |
Day high | $10.80 | Avg. volume | 31,780 |
50-day MA | $9.23 | Dividend yield | 7.14% |
200-day MA | $8.06 | Market Cap | 185.51M |
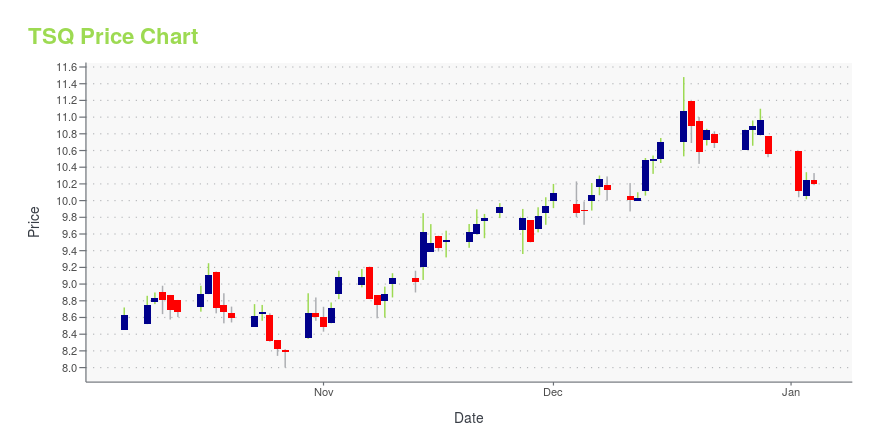
TSQ Stock Price Chart Interactive Chart >
TSQ POWR Grades
- TSQ scores best on the Value dimension, with a Value rank ahead of 78.77% of US stocks.
- The strongest trend for TSQ is in Growth, which has been heading down over the past 179 days.
- TSQ ranks lowest in Momentum; there it ranks in the 3rd percentile.
TSQ Stock Summary
- TOWNSQUARE MEDIA INC's capital turnover -- a measure of revenue relative to shareholder's equity -- is better than 94.58% of US listed stocks.
- Equity multiplier, or assets relative to shareholders' equity, comes in at 12.06 for TOWNSQUARE MEDIA INC; that's greater than it is for 93.5% of US stocks.
- TOWNSQUARE MEDIA INC's shareholder yield -- a measure of how much capital is returned to stockholders via dividends and buybacks -- is 19.17%, greater than the shareholder yield of 90.38% of stocks in our set.
- If you're looking for stocks that are quantitatively similar to TOWNSQUARE MEDIA INC, a group of peers worth examining would be BKD, CBL, MDRR, AIV, and SBGI.
- Visit TSQ's SEC page to see the company's official filings. To visit the company's web site, go to www.townsquaremedia.com.
TSQ Valuation Summary
- TSQ's price/sales ratio is 0.3; this is 62.5% lower than that of the median Consumer Cyclical stock.
- Over the past 107 months, TSQ's price/earnings ratio has gone up 3.1.
Below are key valuation metrics over time for TSQ.
Stock | Date | P/S | P/B | P/E | EV/EBIT |
---|---|---|---|---|---|
TSQ | 2023-05-19 | 0.3 | 2.5 | 20.1 | 15.6 |
TSQ | 2023-05-18 | 0.3 | 2.5 | 20.4 | 15.7 |
TSQ | 2023-05-17 | 0.3 | 2.5 | 19.9 | 15.6 |
TSQ | 2023-05-16 | 0.3 | 2.5 | 20.1 | 15.6 |
TSQ | 2023-05-15 | 0.3 | 2.6 | 21.1 | 15.8 |
TSQ | 2023-05-12 | 0.4 | 2.6 | 21.3 | 15.8 |
TSQ Growth Metrics
- Its 3 year cash and equivalents growth rate is now at -15.5%.
- Its 3 year price growth rate is now at 66.44%.
- Its year over year cash and equivalents growth rate is now at 149.27%.

The table below shows TSQ's growth in key financial areas (numbers in millions of US dollars).
Date | Revenue | Operating Cash Flow | Net Income to Common Stock |
---|---|---|---|
2022-09-30 | 453.379 | 55.085 | 10.326 |
2022-06-30 | 444.024 | 52.95 | 20.471 |
2022-03-31 | 429.438 | 50.292 | 25.509 |
2021-12-31 | 417.957 | 61.143 | 16.736 |
2021-09-30 | 415.873 | 46.204 | 19.355 |
2021-06-30 | 399.949 | 51.009 | 7.745 |
TSQ's Quality Factors
The “Quality” component of the POWR Ratings focuses on 31 different factors of a companies fundamentals and operational strength. Here are some key insights as we drill into the specifics of these quality attributes.- TSQ has a Quality Grade of C, ranking ahead of 52.78% of graded US stocks.
- TSQ's asset turnover comes in at 0.548 -- ranking 14th of 64 Communication stocks.
- CNSL, LBRDA, and ATNI are the stocks whose asset turnover ratios are most correlated with TSQ.
The table below shows TSQ's key quality metrics over time.
Period | Asset Turnover | Gross Margin | ROIC |
---|---|---|---|
2021-06-30 | 0.548 | 0.294 | 0.073 |
2021-03-31 | 0.496 | 0.249 | 0.001 |
2020-12-31 | 0.477 | 0.240 | -0.096 |
2020-09-30 | 0.465 | 0.235 | -0.244 |
2020-06-30 | 0.449 | 0.255 | -0.228 |
2020-03-31 | 0.458 | 0.296 | -0.157 |
TSQ Price Target
For more insight on analysts targets of TSQ, see our TSQ price target page. And for a list of of all stocks sorted by upside potential based on analyst target price, see our Top Price Target page.
Average Price Target | $20.67 | Average Broker Recommendation | 1.17 (Strong Buy) |
Townsquare Media, Inc. (TSQ) Company Bio
Townsquare Media owns and operates radio stations, digital and social properties, and live events, as well as offers audience original entertainment, music, and lifestyle media. The company was founded in 1996 and is based in Greenwich, Connecticut.
Latest TSQ News From Around the Web
Below are the latest news stories about TOWNSQUARE MEDIA INC that investors may wish to consider to help them evaluate TSQ as an investment opportunity.
Gabelli Funds to Host 15th Annual Media & Entertainment Symposium Thursday, June 8, 2023RYE, N. Y., June 07, 2023 (GLOBE NEWSWIRE) -- Gabelli Funds will host its 15th Annual Media & Entertainment Symposium at the Harvard Club in New York City on Thursday, June 8, 2023. The symposium will feature discussions with leading companies and organizations across the media ecosystem, with an emphasis on industry dynamics, current trends, and business fundamentals, as well as a Sports Investing Panel. Attendees will also have the opportunity to meet with management in a one-on-one setting. F |
Is Townsquare Media, Inc. (NYSE:TSQ) Potentially Undervalued?Townsquare Media, Inc. ( NYSE:TSQ ), might not be a large cap stock, but it received a lot of attention from a... |
14 Biggest Radio Companies in the USIn this article, we will take a look at the 14 biggest radio companies in the US. To see more such companies, go directly to 5 Biggest Radio Companies in the US. Back in 2019, when Duncan Stewart, Director of Research, TMT, at Deloitte predicted that radio audience from the age group 18-34 would surpass […] |
Townsquare Media (TSQ) Q1 Earnings and Revenues Beat EstimatesTownsquare (TSQ) delivered earnings and revenue surprises of 60% and 2.46%, respectively, for the quarter ended March 2023. Do the numbers hold clues to what lies ahead for the stock? |
TOWNSQUARE ANNOUNCES FIRST QUARTER RESULTS WHICH DEMONSTRATE ONGOING STRENGTH OF ITS DIGITAL FIRST STRATEGYTownsquare Media, Inc. (NYSE: TSQ) ("Townsquare", the "Company," "we," "us," or "our") announced today its financial results for the first quarter ended March 31, 2023. |
TSQ Price Returns
1-mo | 9.39% |
3-mo | 28.74% |
6-mo | 49.93% |
1-year | 12.68% |
3-year | 96.02% |
5-year | 73.05% |
YTD | 49.51% |
2022 | -45.61% |
2021 | 100.15% |
2020 | -32.10% |
2019 | 156.00% |
2018 | -44.29% |
TSQ Dividends
Ex-Dividend Date | Type | Payout Amount | Change | ||||||
---|---|---|---|---|---|---|---|---|---|
Loading, please wait... |
Continue Researching TSQ
Want to do more research on Townsquare Media Inc's stock and its price? Try the links below:Townsquare Media Inc (TSQ) Stock Price | Nasdaq
Townsquare Media Inc (TSQ) Stock Quote, History and News - Yahoo Finance
Townsquare Media Inc (TSQ) Stock Price and Basic Information | MarketWatch
Loading social stream, please wait...