
Trade Desk Inc. Cl A (TTD): Price and Financial Metrics
TTD Price/Volume Stats
| Current price | $92.43 | 52-week high | $102.67 |
| Prev. close | $90.88 | 52-week low | $60.23 |
| Day low | $90.75 | Volume | 2,699,975 |
| Day high | $93.02 | Avg. volume | 4,136,125 |
| 50-day MA | $96.32 | Dividend yield | N/A |
| 200-day MA | $81.56 | Market Cap | 45.21B |
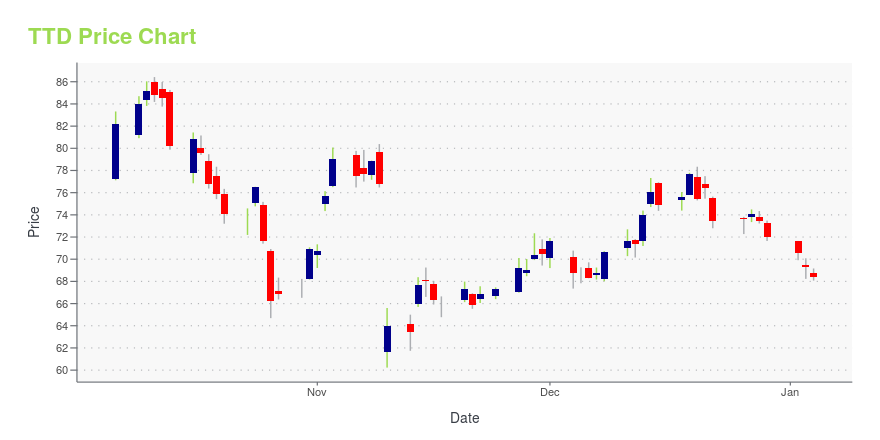
TTD Stock Price Chart Interactive Chart >
Trade Desk Inc. Cl A (TTD) Company Bio
The Trade Desk (stylized as theTradeDesk) is an American multinational technology company that specializes in real-time programmatic marketing automation technologies, products, and services, designed to personalize digital content delivery to users. (Source:Wikipedia)
Latest TTD News From Around the Web
Below are the latest news stories about TRADE DESK INC that investors may wish to consider to help them evaluate TTD as an investment opportunity.
Cloud Computing Kings: 7 Stocks Dominating the Digital SkyCloud computing stocks have outperformed the market and these seven look like they can continue the trend. |
Internet stocks will continue to do well in 2024: Citi analystThe Magnificent Seven and Big Tech stocks dominated the markets this year. But what's in store for 2024? Citi Director of Internet Equity Research Ygal Arounian joins Yahoo Finance Live to discuss his outlook for internet stocks next year. Arounian expects another strong year for internet stocks for several reasons, including strong fundamentals, potential Federal Reserve rate cuts, and a recovery in consumer spending. Arounian expects the generative AI hype to continue into 2024, saying he thinks that next year, investors will see more "actual real implementation of AI across different end businesses that will start to drive more meaningful change." When it comes to stocks Arounian likes for 2024, he is picking The Trade Desk (TTD), Wayfair (W), and VeriSign (VRSN). Click here to watch... |
2 Super Stocks That Are Screaming Buys Right NowThe market has been rallying, but there are still some good buys available. |
Brokers Suggest Investing in The Trade Desk (TTD): Read This Before Placing a BetThe average brokerage recommendation (ABR) for The Trade Desk (TTD) is equivalent to a Buy. The overly optimistic recommendations of Wall Street analysts make the effectiveness of this highly sought-after metric questionable. So, is it worth buying the stock? |
Director Gokul Rajaram Sells Shares of The Trade Desk IncOn December 20, 2023, Gokul Rajaram, a director at The Trade Desk Inc (NASDAQ:TTD), executed a sale of 2,999 shares of the company's stock, according to a SEC Filing. |
TTD Price Returns
| 1-mo | -5.40% |
| 3-mo | 9.09% |
| 6-mo | 35.91% |
| 1-year | 8.26% |
| 3-year | 11.79% |
| 5-year | 231.83% |
| YTD | 28.45% |
| 2023 | 60.52% |
| 2022 | -51.08% |
| 2021 | 14.41% |
| 2020 | 208.34% |
| 2019 | 123.83% |
Continue Researching TTD
Here are a few links from around the web to help you further your research on Trade Desk Inc's stock as an investment opportunity:Trade Desk Inc (TTD) Stock Price | Nasdaq
Trade Desk Inc (TTD) Stock Quote, History and News - Yahoo Finance
Trade Desk Inc (TTD) Stock Price and Basic Information | MarketWatch
Loading social stream, please wait...