
Tradeweb Markets Inc. (TW): Price and Financial Metrics
TW Price/Volume Stats
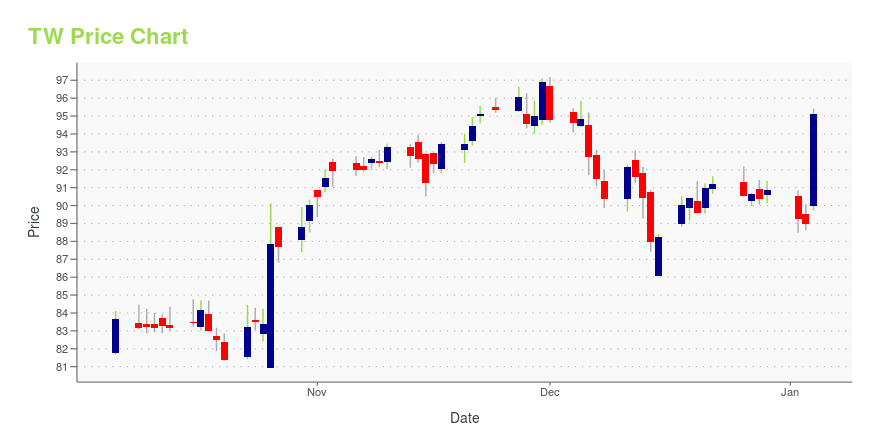
| Current price | $128.76 | 52-week high | $152.65 |
| Prev. close | $130.20 | 52-week low | $110.62 |
| Day low | $128.55 | Volume | 848,856 |
| Day high | $131.10 | Avg. volume | 1,180,203 |
| 50-day MA | $137.66 | Dividend yield | 0.37% |
| 200-day MA | $0.00 | Market Cap | 30.45B |
TW Stock Price Chart Interactive Chart >
Tradeweb Markets Inc. (TW) Company Bio
Tradeweb Markets Inc. (Tradeweb) is an international financial services company that builds and operates electronic over-the-counter (OTC) marketplaces for trading fixed income products, ETFs, and derivatives. The company was co-founded in 1996 by Lee Olesky and Jim Toffey. Its customers include banks, asset managers, central banks, pension funds and insurance companies. (Source:Wikipedia)
TW Price Returns
| 1-mo | -6.70% |
| 3-mo | -12.22% |
| 6-mo | -0.45% |
| 1-year | 11.36% |
| 3-year | 78.75% |
| 5-year | 138.37% |
| YTD | -1.48% |
| 2024 | 44.69% |
| 2023 | 40.61% |
| 2022 | -34.86% |
| 2021 | 60.96% |
| 2020 | 35.50% |
TW Dividends
| Ex-Dividend Date | Type | Payout Amount | Change | ||||||
|---|---|---|---|---|---|---|---|---|---|
| Loading, please wait... | |||||||||
Loading social stream, please wait...