
Tradeweb Markets Inc. (TW): Price and Financial Metrics
TW Price/Volume Stats
| Current price | $106.84 | 52-week high | $114.07 |
| Prev. close | $104.99 | 52-week low | $74.82 |
| Day low | $104.92 | Volume | 1,144,884 |
| Day high | $107.15 | Avg. volume | 893,451 |
| 50-day MA | $107.18 | Dividend yield | 0.36% |
| 200-day MA | $99.77 | Market Cap | 25.23B |
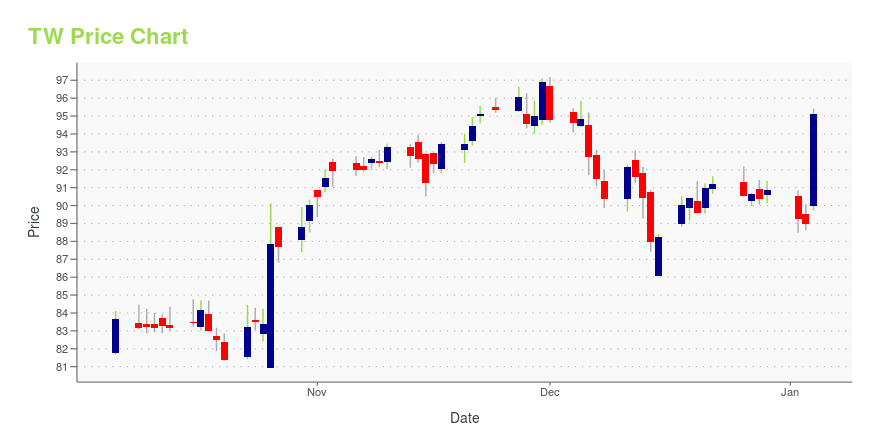
TW Stock Price Chart Interactive Chart >
Tradeweb Markets Inc. (TW) Company Bio
Tradeweb Markets Inc. (Tradeweb) is an international financial services company that builds and operates electronic over-the-counter (OTC) marketplaces for trading fixed income products, ETFs, and derivatives. The company was co-founded in 1996 by Lee Olesky and Jim Toffey. Its customers include banks, asset managers, central banks, pension funds and insurance companies. (Source:Wikipedia)
Latest TW News From Around the Web
Below are the latest news stories about TRADEWEB MARKETS INC that investors may wish to consider to help them evaluate TW as an investment opportunity.
Zacks.com featured highlights include Beacon Roofing Supply, Deckers Outdoor, A. O. Smith Assurant and Tradeweb MarketsBeacon Roofing Supply, Deckers Outdoor, A. O. Smith, Assurant and Tradeweb Markets are part of the Zacks Screen of the Week article. |
All You Need to Know About Tradeweb (TW) Rating Upgrade to BuyTradeweb (TW) might move higher on growing optimism about its earnings prospects, which is reflected by its upgrade to a Zacks Rank #2 (Buy). |
Liquidity is in the Eye of the Beholder: How Directional Liquidity Scoring Spotlights the Ability to Buy and Sell a BondCo-authored by Jonathan Rick, Director, Data Product Management, Tradeweb & Emil Parmar, Director, Credit Trading Solutions, LSEG |
Tradeweb Enters Next Phase of Partnership with BlackRockNEW YORK, December 11, 2023--Tradeweb Markets Inc. (Nasdaq: TW), a leading, global operator of electronic marketplaces for rates, credit, equities and money markets, today introduced the next phase of its previously announced platform integration with BlackRock’s Aladdin order execution management system (OEMS). |
Do Tradeweb Markets' (NASDAQ:TW) Earnings Warrant Your Attention?The excitement of investing in a company that can reverse its fortunes is a big draw for some speculators, so even... |
TW Price Returns
| 1-mo | 0.81% |
| 3-mo | 5.10% |
| 6-mo | 9.51% |
| 1-year | 33.42% |
| 3-year | 24.62% |
| 5-year | 127.43% |
| YTD | 17.89% |
| 2023 | 40.61% |
| 2022 | -34.86% |
| 2021 | 60.96% |
| 2020 | 35.50% |
| 2019 | N/A |
TW Dividends
| Ex-Dividend Date | Type | Payout Amount | Change | ||||||
|---|---|---|---|---|---|---|---|---|---|
| Loading, please wait... | |||||||||
Loading social stream, please wait...