Texas Roadhouse, Inc. (TXRH): Price and Financial Metrics
GET POWR RATINGS... FREE!
TXRH POWR Grades
- TXRH scores best on the Quality dimension, with a Quality rank ahead of 83.17% of US stocks.
- The strongest trend for TXRH is in Momentum, which has been heading down over the past 179 days.
- TXRH ranks lowest in Stability; there it ranks in the 36th percentile.
TXRH Stock Summary
- The capital turnover (annual revenue relative to shareholder's equity) for TXRH is 3.27 -- better than 85.45% of US stocks.
- With a one year PEG ratio of 1.75, Texas Roadhouse Inc is expected to have a higher PEG ratio (a measure of how expensive a stock is relative to its expected earnings growth) than just 8.21% of US stocks.
- Over the past twelve months, TXRH has reported earnings growth of 1,366.58%, putting it ahead of 98.37% of US stocks in our set.
- Stocks that are quantitatively similar to TXRH, based on their financial statements, market capitalization, and price volatility, are METC, BSM, RPAY, SII, and POWW.
- TXRH's SEC filings can be seen here. And to visit Texas Roadhouse Inc's official web site, go to www.texasroadhouse.com.
TXRH Valuation Summary
- In comparison to the median Consumer Cyclical stock, TXRH's price/sales ratio is 29.03% lower, now standing at 2.2.
- Over the past 206 months, TXRH's price/earnings ratio has gone up 6.3.
- TXRH's price/sales ratio has moved down 0.1 over the prior 206 months.
Below are key valuation metrics over time for TXRH.
Stock | Date | P/S | P/B | P/E | EV/EBIT |
---|---|---|---|---|---|
TXRH | 2021-08-27 | 2.2 | 6.4 | 35.4 | 31.9 |
TXRH | 2021-08-26 | 2.2 | 6.2 | 34.3 | 30.9 |
TXRH | 2021-08-25 | 2.2 | 6.2 | 34.2 | 30.9 |
TXRH | 2021-08-24 | 2.2 | 6.1 | 34.0 | 30.7 |
TXRH | 2021-08-23 | 2.1 | 6.0 | 33.6 | 30.3 |
TXRH | 2021-08-20 | 2.1 | 6.0 | 33.4 | 30.2 |
TXRH Growth Metrics
- The 3 year revenue growth rate now stands at 35.31%.
- Its year over year price growth rate is now at 115.51%.
- Its 3 year net cashflow from operations growth rate is now at 52.03%.

The table below shows TXRH's growth in key financial areas (numbers in millions of US dollars).
Date | Revenue | Operating Cash Flow | Net Income to Common Stock |
---|---|---|---|
2021-12-31 | 3,463.946 | 468.826 | 245.294 |
2021-09-30 | 3,206.349 | 433.112 | 211.785 |
2021-06-30 | 2,968.591 | 465.439 | 188.409 |
2021-03-31 | 2,546.228 | 386.735 | 79.376 |
2020-12-31 | 2,398.123 | 230.438 | 31.255 |
2020-09-30 | 2,485.372 | 278.336 | 54.392 |
TXRH's Quality Factors
The “Quality” component of the POWR Ratings focuses on 31 different factors of a companies fundamentals and operational strength. Here are some key insights as we drill into the specifics of these quality attributes.- TXRH has a Quality Grade of B, ranking ahead of 76.8% of graded US stocks.
- TXRH's asset turnover comes in at 1.267 -- ranking 4th of 79 Restaraunts Hotels Motels stocks.
- PLAY, CHUY, and NATH are the stocks whose asset turnover ratios are most correlated with TXRH.
The table below shows TXRH's key quality metrics over time.
Period | Asset Turnover | Gross Margin | ROIC |
---|---|---|---|
2021-06-29 | 1.267 | 0.189 | 0.102 |
2021-03-30 | 1.125 | 0.161 | 0.039 |
2020-12-29 | 1.103 | 0.141 | 0.009 |
2020-09-29 | 1.190 | 0.152 | 0.025 |
2020-06-30 | 1.249 | 0.157 | 0.031 |
2020-03-31 | 1.401 | 0.186 | 0.084 |
TXRH Price Target
For more insight on analysts targets of TXRH, see our TXRH price target page. And for a list of of all stocks sorted by upside potential based on analyst target price, see our Top Price Target page.
Average Price Target | $105.95 | Average Broker Recommendation | 1.81 (Hold) |
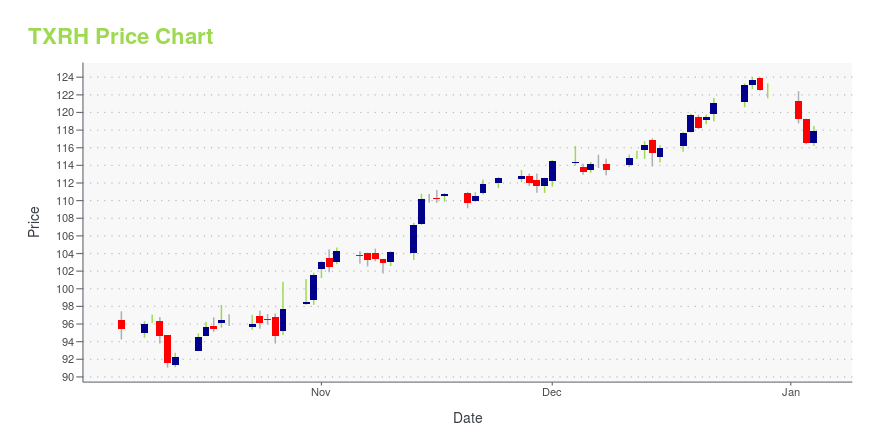
TXRH Stock Price Chart Interactive Chart >
TXRH Price/Volume Stats
Current price | $92.79 | 52-week high | $97.43 |
Prev. close | $89.20 | 52-week low | $68.58 |
Day low | $91.20 | Volume | 738,000 |
Day high | $93.03 | Avg. volume | 1,158,820 |
50-day MA | $80.18 | Dividend yield | 2.06% |
200-day MA | $83.81 | Market Cap | 6.33B |
Texas Roadhouse, Inc. (TXRH) Company Bio
Texas Roadhouse operates its restaurants primarily under the Texas Roadhouse name, offering an assortment of seasoned and aged steaks. The company was founded in 1993 and is based in Louisville, Kentucky.
Latest TXRH News From Around the Web
Below are the latest news stories about Texas Roadhouse Inc that investors may wish to consider to help them evaluate TXRH as an investment opportunity.
Texas Roadhouse, Inc. (TXRH) CEO Jerry Morgan On Q4 2021 Results - Earnings Call TranscriptTexas Roadhouse, Inc. (TXRH) Q4 2021 Earnings Conference Call February 22, 2022 5:00 PM ET Company Participants Tonya Robinson - Chief Financial Officer Jerry Morgan - Chief Executive Officer Conference Call Participants Brian Bittner - Oppenheimer David Tarantino - Baird Dennis Geiger - UBS Lauren Silberman - Credit Suisse Jeff... |
Texas Roadhouse leans on pricing to offset labor, food costsTexas Roadhouse slid past consensus estimates with its Q4 earnings report on comparable sales growth 18.8% higher than the pre-pandemic level in 2019. Read more. |
Texas Roadhouse GAAP EPS of $0.76 beats by $0.08, revenue of $895.59M beats by $3.06MTexas Roadhouse press release (NASDAQ:TXRH): Q4 GAAP EPS of $0.76 beats by $0.08. Revenue of $895.59M (+40.4% Y/Y) beats by $3.06M. Comparable restaurant sales at company restaurants increased 33.1% and 21.2% compared to 2020 and 2019. Comparable restaurant sales at domestic franchise restaurants increased 34.8% and 18.8% compared to 2020... |
Texas Roadhouse (TXRH) Q4 Earnings Beat EstimatesTexas Roadhouse (TXRH) delivered earnings and revenue surprises of 13.43% and 0.22%, respectively, for the quarter ended December 2021. Do the numbers hold clues to what lies ahead for the stock? |
Texas Roadhouse, Inc. Announces Fourth Quarter 2021 ResultsIncreases Quarterly Dividend by 15% to $0.46 per ShareLOUISVILLE, Ky., Feb. 22, 2022 (GLOBE NEWSWIRE) -- Texas Roadhouse, Inc. (NasdaqGS: TXRH), today announced financial results for the 13 and 52 weeks ended December 28, 2021. Financial Results Financial results for the 13 and 52 weeks ended December 28, 2021 and December 29, 2020, and 14 and 53 weeks ended December 31, 2019 were as follows: Fourth Quarter($000's) % change 2021 2020 2019 vs. 2020 vs. 2019Total revenue$895,586 $637,989 $725,238 |
TXRH Price Returns
1-mo | 18.11% |
3-mo | 22.02% |
6-mo | 3.75% |
1-year | 4.68% |
3-year | 78.00% |
5-year | 103.75% |
YTD | 5.21% |
2021 | 15.71% |
2020 | 39.83% |
2019 | -3.62% |
2018 | 15.11% |
2017 | 11.16% |
TXRH Dividends
Ex-Dividend Date | Type | Payout Amount | Change | ||||||
---|---|---|---|---|---|---|---|---|---|
Loading, please wait... |
Continue Researching TXRH
Want to do more research on Texas Roadhouse Inc's stock and its price? Try the links below:Texas Roadhouse Inc (TXRH) Stock Price | Nasdaq
Texas Roadhouse Inc (TXRH) Stock Quote, History and News - Yahoo Finance
Texas Roadhouse Inc (TXRH) Stock Price and Basic Information | MarketWatch
Loading social stream, please wait...