Textron Inc. (TXT): Price and Financial Metrics
GET POWR RATINGS... FREE!
TXT POWR Grades
- TXT scores best on the Value dimension, with a Value rank ahead of 90.6% of US stocks.
- The strongest trend for TXT is in Growth, which has been heading down over the past 179 days.
- TXT's current lowest rank is in the Growth metric (where it is better than 21.43% of US stocks).
TXT Stock Summary
- Textron Inc's stock had its IPO on January 1, 1986, making it an older stock than 92.84% of US equities in our set.
- Of note is the ratio of Textron Inc's sales and general administrative expense to its total operating expenses; 98.75% of US stocks have a lower such ratio.
- In terms of volatility of its share price, TXT is more volatile than only 6.73% of stocks we're observing.
- Stocks with similar financial metrics, market capitalization, and price volatility to Textron Inc are L, WPP, WHR, CCEP, and AEG.
- Visit TXT's SEC page to see the company's official filings. To visit the company's web site, go to www.textron.com.
TXT Valuation Summary
- In comparison to the median Industrials stock, TXT's EV/EBIT ratio is 7.94% lower, now standing at 19.7.
- Over the past 243 months, TXT's EV/EBIT ratio has gone up 3.4.
- TXT's price/sales ratio has moved up 0.7 over the prior 243 months.
Below are key valuation metrics over time for TXT.
Stock | Date | P/S | P/B | P/E | EV/EBIT |
---|---|---|---|---|---|
TXT | 2021-08-26 | 1.3 | 2.6 | 22.8 | 19.7 |
TXT | 2021-08-25 | 1.3 | 2.7 | 23.4 | 20.2 |
TXT | 2021-08-24 | 1.3 | 2.7 | 23.1 | 20.0 |
TXT | 2021-08-23 | 1.3 | 2.6 | 22.7 | 19.7 |
TXT | 2021-08-20 | 1.3 | 2.6 | 22.6 | 19.5 |
TXT | 2021-08-19 | 1.3 | 2.6 | 22.2 | 19.3 |
TXT Growth Metrics
- The 5 year revenue growth rate now stands at -1.87%.
- The 2 year net cashflow from operations growth rate now stands at -28.37%.
- The year over year price growth rate now stands at 140.81%.

The table below shows TXT's growth in key financial areas (numbers in millions of US dollars).
Date | Revenue | Operating Cash Flow | Net Income to Common Stock |
---|---|---|---|
2021-12-31 | 12,382 | 1,468 | 746 |
2021-09-30 | 12,727 | 1,786 | 775 |
2021-06-30 | 12,472 | 1,752 | 705 |
2021-03-31 | 11,753 | 1,407 | 430 |
2020-12-31 | 11,651 | 832 | 309 |
2020-09-30 | 12,019 | 954 | 272 |
TXT's Quality Factors
The “Quality” component of the POWR Ratings focuses on 31 different factors of a companies fundamentals and operational strength. Here are some key insights as we drill into the specifics of these quality attributes.- TXT has a Quality Grade of B, ranking ahead of 78.61% of graded US stocks.
- TXT's asset turnover comes in at 0.828 -- ranking 5th of 21 Aircraft stocks.
- SPR, RTX, and HON are the stocks whose asset turnover ratios are most correlated with TXT.
The table below shows TXT's key quality metrics over time.
Period | Asset Turnover | Gross Margin | ROIC |
---|---|---|---|
2021-10-02 | 0.828 | 0.162 | 0.083 |
2021-07-03 | 0.803 | 0.157 | 0.075 |
2021-04-03 | 0.756 | 0.140 | 0.048 |
2021-01-02 | 0.743 | 0.134 | 0.038 |
2020-10-03 | 0.772 | 0.134 | 0.038 |
2020-07-04 | 0.816 | 0.137 | 0.048 |
TXT Price Target
For more insight on analysts targets of TXT, see our TXT price target page. And for a list of of all stocks sorted by upside potential based on analyst target price, see our Top Price Target page.
Average Price Target | $83.75 | Average Broker Recommendation | 1.5 (Moderate Buy) |
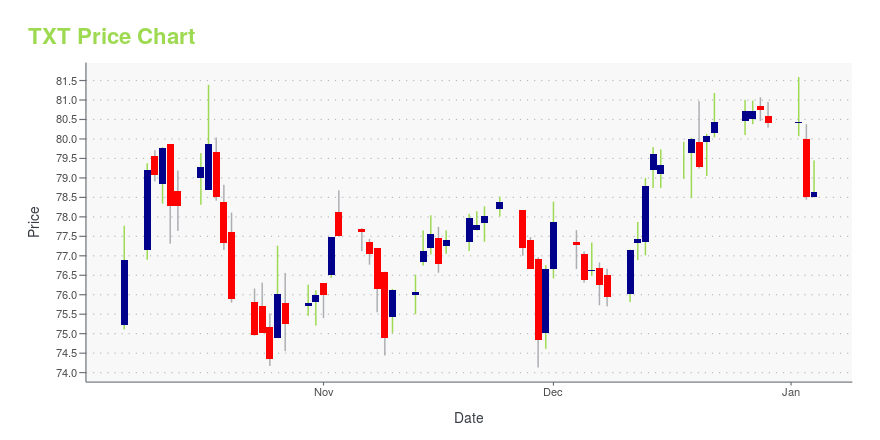
TXT Stock Price Chart Interactive Chart >
TXT Price/Volume Stats
Current price | $60.79 | 52-week high | $79.45 |
Prev. close | $60.62 | 52-week low | $57.11 |
Day low | $59.95 | Volume | 897,700 |
Day high | $61.26 | Avg. volume | 1,303,093 |
50-day MA | $65.14 | Dividend yield | 0.13% |
200-day MA | $70.84 | Market Cap | 13.07B |
Textron Inc. (TXT) Company Bio
Textron engages in the purchase, ownership, management, leasing, and disposal of a fleet of intermodal containers worldwide. It operates through three segments: Container Ownership, Container Management, and Container Resale. The company was founded in 1979 and is based in Hamilton, Bermuda.
Latest TXT News From Around the Web
Below are the latest news stories about Textron Inc that investors may wish to consider to help them evaluate TXT as an investment opportunity.
Textron declares $0.02 dividendTextron (NYSE:TXT) declares $0.02/share quarterly dividend, in line with previous. Forward yield 0.12% Payable April 1; for shareholders of record March 11; ex-div March 10. See TXT Dividend Scorecard, Yield Chart, & Dividend Growth.... |
General aviation deliveries top 2,600 for 2021Global deliveries of general aviation aircraft rose to 2,630 in 2021 and a Wichita company helped lead the way. According to new data from the General Aviation Manufacturers Association, deliveries of piston aircraft worldwide rose 5.5% year over year to 1,393, while business jet deliveries increased 10.2% to 710 aircraft. The largest segment gain was for turboprop aircraft, which rose 19% to 527 deliveries year over year. |
Textron Elects Richard F. Ambrose to Board of DirectorsPROVIDENCE, R.I., February 23, 2022--Richard F. Ambrose has been elected to the Textron Board of Directors. It is effective April 1, 2022. |
Textron Declares Quarterly DividendPROVIDENCE, R.I., February 23, 2022--Textron has declared its quarterly dividend. |
Spirit AeroSystems HQ moving to 100% wind energy using local sourcesFollowing through on a goal highlighted in its first sustainability report released last year, Spirit AeroSystems announced Wednesday that its company headquarters in Wichita is converting to 100% wind-generated electricity coming from local sources. “Harnessing a local renewable and reliable resource dramatically reduces our corporate carbon emissions, a key priority for Spirit in achieving our sustainability goals,” said Tom Gentile, president and CEO of Spirit AeroSystems, in a news release. “Improving both our environmental and operational performance builds competitiveness in our business, which means we can continue to support our local economy and secure our long-term future in Kansas.” |
TXT Price Returns
1-mo | -7.92% |
3-mo | -19.14% |
6-mo | -20.91% |
1-year | -9.13% |
3-year | 15.56% |
5-year | 31.79% |
YTD | -20.94% |
2021 | 59.93% |
2020 | 8.60% |
2019 | -2.86% |
2018 | -18.62% |
2017 | 16.72% |
TXT Dividends
Ex-Dividend Date | Type | Payout Amount | Change | ||||||
---|---|---|---|---|---|---|---|---|---|
Loading, please wait... |
Continue Researching TXT
Want to see what other sources are saying about Textron Inc's financials and stock price? Try the links below:Textron Inc (TXT) Stock Price | Nasdaq
Textron Inc (TXT) Stock Quote, History and News - Yahoo Finance
Textron Inc (TXT) Stock Price and Basic Information | MarketWatch
Loading social stream, please wait...