Under Armour Inc. Cl A (UAA): Price and Financial Metrics
GET POWR RATINGS... FREE!
UAA POWR Grades
- UAA scores best on the Quality dimension, with a Quality rank ahead of 69.34% of US stocks.
- UAA's strongest trending metric is Sentiment; it's been moving up over the last 177 days.
- UAA ranks lowest in Stability; there it ranks in the 15th percentile.
UAA Stock Summary
- The capital turnover (annual revenue relative to shareholder's equity) for UAA is 3.17 -- better than 83.79% of US stocks.
- Of note is the ratio of UNDER ARMOUR INC's sales and general administrative expense to its total operating expenses; 83.11% of US stocks have a lower such ratio.
- UNDER ARMOUR INC's shareholder yield -- a measure of how much capital is returned to stockholders via dividends and buybacks -- is 10.71%, greater than the shareholder yield of 83.53% of stocks in our set.
- Stocks with similar financial metrics, market capitalization, and price volatility to UNDER ARMOUR INC are GCO, BGFV, SMP, URBN, and NUS.
- UAA's SEC filings can be seen here. And to visit UNDER ARMOUR INC's official web site, go to www.underarmour.com.
UAA Valuation Summary
- In comparison to the median Consumer Cyclical stock, UAA's price/sales ratio is 12.5% lower, now standing at 0.7.
- Over the past 211 months, UAA's EV/EBIT ratio has gone down 19.5.
Below are key valuation metrics over time for UAA.
Stock | Date | P/S | P/B | P/E | EV/EBIT |
---|---|---|---|---|---|
UAA | 2023-03-22 | 0.7 | 2.1 | 24.8 | 19.9 |
UAA | 2023-03-21 | 0.7 | 2.1 | 24.9 | 20.0 |
UAA | 2023-03-20 | 0.7 | 2.1 | 24.6 | 19.8 |
UAA | 2023-03-17 | 0.7 | 2.1 | 24.4 | 19.7 |
UAA | 2023-03-16 | 0.7 | 2.1 | 24.3 | 19.6 |
UAA | 2023-03-15 | 0.6 | 2.0 | 22.9 | 18.6 |
UAA Growth Metrics
- Its 3 year cash and equivalents growth rate is now at 249.51%.
- The 2 year net income to common stockholders growth rate now stands at 142.82%.
- The year over year net income to common stockholders growth rate now stands at 88.32%.

The table below shows UAA's growth in key financial areas (numbers in millions of US dollars).
Date | Revenue | Operating Cash Flow | Net Income to Common Stock |
---|---|---|---|
2022-12-31 | 5,805.668 | -247.044 | 156.614 |
2022-09-30 | 5,753.092 | 131.019 | 144.654 |
2022-06-30 | 5,724.739 | 328.647 | 171.173 |
2022-03-31 | 5,727.216 | 493.974 | 222.698 |
2021-12-31 | 5,683.466 | 664.829 | 360.06 |
2021-09-30 | 5,558.027 | 672.439 | 434.856 |
UAA's Quality Factors
The “Quality” component of the POWR Ratings focuses on 31 different factors of a companies fundamentals and operational strength. Here are some key insights as we drill into the specifics of these quality attributes.- UAA has a Quality Grade of B, ranking ahead of 90.97% of graded US stocks.
- UAA's asset turnover comes in at 1.132 -- ranking 10th of 32 Apparel stocks.
- SHOO, COLM, and OXM are the stocks whose asset turnover ratios are most correlated with UAA.
The table below shows UAA's key quality metrics over time.
Period | Asset Turnover | Gross Margin | ROIC |
---|---|---|---|
2021-09-30 | 1.132 | 0.500 | 0.160 |
2021-06-30 | 1.107 | 0.492 | 0.127 |
2021-03-31 | 0.969 | 0.491 | 0.055 |
2020-12-31 | 0.907 | 0.483 | -0.116 |
2020-09-30 | 0.923 | 0.476 | -0.172 |
2020-06-30 | 0.934 | 0.477 | -0.152 |
UAA Price Target
For more insight on analysts targets of UAA, see our UAA price target page. And for a list of of all stocks sorted by upside potential based on analyst target price, see our Top Price Target page.
Average Price Target | $27.04 | Average Broker Recommendation | 1.73 (Moderate Buy) |
UAA Stock Price Chart Interactive Chart >
UAA Price/Volume Stats
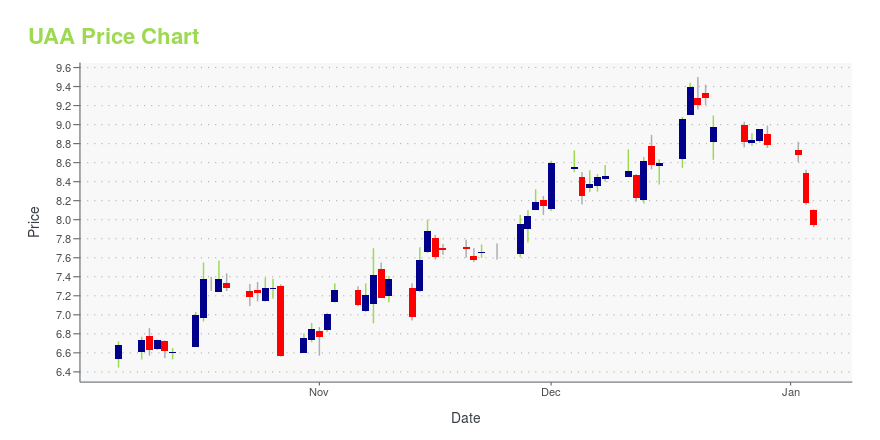
Current price | $9.30 | 52-week high | $18.17 |
Prev. close | $9.29 | 52-week low | $6.38 |
Day low | $9.27 | Volume | 5,912,100 |
Day high | $9.50 | Avg. volume | 7,828,341 |
50-day MA | $10.28 | Dividend yield | N/A |
200-day MA | $9.24 | Market Cap | 4.13B |
Under Armour Inc. Cl A (UAA) Company Bio
Under Armour, Inc. is an American sports equipment company that manufactures footwear, sports and casual apparel. Under Armour's global headquarters are located in Baltimore, Maryland, with additional offices located in Amsterdam (European headquarters), Austin, Guangzhou, Hong Kong, Houston, Jakarta, London, Mexico City, Munich, New York City, Panama City (international headquarters), Paris, Pittsburgh, Portland, San Francisco, São Paulo, Santiago, Seoul, Shanghai (Greater Chinese headquarters), and Toronto. (Source:Wikipedia)
Latest UAA News From Around the Web
Below are the latest news stories about UNDER ARMOUR INC that investors may wish to consider to help them evaluate UAA as an investment opportunity.
Inside Foot Locker CEO's plan to run a better businessFoot Locker CEO Mary Dillon takes Yahoo Finance inside her revival plan for the sneaker retailer. |
Zacks Industry Outlook Highlights Lululemon Athletica, Ralph Lauren, Crocs, PVH and Under ArmourLululemon Athletica, Ralph Lauren, Crocs, PVH and Under Armour are part of the Zacks Industry Outlook article. |
5 Textile - Apparel Stocks to Watch Despite Industry HeadwindsThe Zacks Textile - Apparel industry participants are battling persistent inflationary pressure and supply-chain issues. Effective digital efforts bode well for Lululemon (LULU), Ralph Lauren (RL), Columbia Sportswear (COLM), PVH Corp. (PVH) and Under Armour (UAA). |
5 analyst calls of the day: Tesla slashed again | Pro RecapWolfe Research downgraded Tesla (NASDAQ:TSLA) to Peer Perform from Outperform. While the firm remains positive on Tesla's long-term opportunity and "impressive cost trajectory," it is growing increasingly concerned about macro challenges facing the EV maker. Tesla has had to lower prices more than expected, and there are macro challenges that could hurt EV makers even more. |
Inside the Great Athletic Leadership Shakeup: The C-Suite Hiring Trends to Know NowWomen from outside the industry are edging their way in — and nabbing top jobs. |
UAA Price Returns
1-mo | -5.20% |
3-mo | -8.46% |
6-mo | 39.85% |
1-year | -45.36% |
3-year | 0.98% |
5-year | -43.12% |
YTD | -8.46% |
2022 | -52.05% |
2021 | 23.41% |
2020 | -20.51% |
2019 | 22.24% |
2018 | 22.45% |
Continue Researching UAA
Want to see what other sources are saying about Under Armour Inc's financials and stock price? Try the links below:Under Armour Inc (UAA) Stock Price | Nasdaq
Under Armour Inc (UAA) Stock Quote, History and News - Yahoo Finance
Under Armour Inc (UAA) Stock Price and Basic Information | MarketWatch
Loading social stream, please wait...