United-Guardian, Inc. (UG): Price and Financial Metrics

United-Guardian, Inc. (UG): $9.03

-0.01 (-0.11%)

POWR Rating

Component Grades

Momentum

C

Stability

C

Sentiment

Quality

A

Add UG to Watchlist
Sign Up

Industry: Consumer Goods

Industry

C

Ranked

#7 of 61

in industry

UG Price/Volume Stats
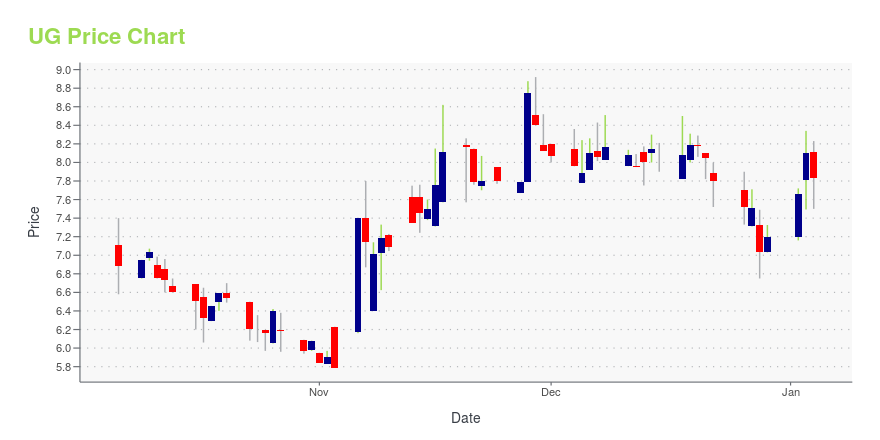
Current price $9.03 52-week high $19.12
Prev. close $9.04 52-week low $8.42
Day low $9.01 Volume 4,100
Day high $9.27 Avg. volume 6,027
50-day MA $9.38 Dividend yield 7.05%
200-day MA $11.24 Market Cap 41.48M

UG Stock Price Chart Interactive Chart >

UG Stock Summary

  • For UG, its debt to operating expenses ratio is greater than that reported by merely 0.41% of US equities we're observing.
  • Equity multiplier, or assets relative to shareholders' equity, comes in at 1.18 for UNITED GUARDIAN INC; that's greater than it is for merely 12.63% of US stocks.
  • As for revenue growth, note that UG's revenue has grown -20.95% over the past 12 months; that beats the revenue growth of only 10.88% of US companies in our set.
  • Stocks that are quantitatively similar to UG, based on their financial statements, market capitalization, and price volatility, are CMCM, ITRN, VOXX, BELFA, and CPIX.
  • Visit UG's SEC page to see the company's official filings. To visit the company's web site, go to www.u-g.com.

UG Valuation Summary

  • UG's price/sales ratio is 3.6; this is 100% higher than that of the median Consumer Defensive stock.
  • UG's price/earnings ratio has moved down 1.5 over the prior 243 months.

Below are key valuation metrics over time for UG.

Stock Date P/S P/B P/E EV/EBIT
UG 2023-05-23 3.6 4.1 16.9 13.0
UG 2023-05-22 3.6 4.0 16.7 12.9
UG 2023-05-19 3.7 4.2 17.3 13.4
UG 2023-05-18 3.8 4.3 17.7 13.7
UG 2023-05-17 3.7 4.2 17.6 13.6
UG 2023-05-16 3.8 4.3 17.9 13.8

UG Growth Metrics

    Its 4 year net cashflow from operations growth rate is now at 74.71%.
  • Its 3 year net income to common stockholders growth rate is now at -2.8%.
  • Its 3 year net cashflow from operations growth rate is now at -9.59%.
Over the past 15 months, UG's revenue has gone up $1,799,225.

The table below shows UG's growth in key financial areas (numbers in millions of US dollars).

Date Revenue Operating Cash Flow Net Income to Common Stock
2022-09-30 13.59659 3.564989 3.006617
2022-06-30 14.35932 3.86057 3.677605
2022-03-31 14.39112 4.350486 4.388805
2021-12-31 13.92963 5.313277 4.658542
2021-09-30 12.64076 4.32128 4.15276
2021-06-30 11.79737 3.028069 3.853786


UG Latest News Stream


Event/Time News Detail
Loading, please wait...

UG Latest Social Stream


Loading social stream, please wait...

View Full UG Social Stream

Latest UG News From Around the Web

Below are the latest news stories about UNITED GUARDIAN INC that investors may wish to consider to help them evaluate UG as an investment opportunity.

The Returns On Capital At United-Guardian (NASDAQ:UG) Don't Inspire Confidence

When we're researching a company, it's sometimes hard to find the warning signs, but there are some financial metrics...

Yahoo | June 2, 2023

A Look At The Fair Value Of United-Guardian, Inc. (NASDAQ:UG)

Key Insights Using the 2 Stage Free Cash Flow to Equity, United-Guardian fair value estimate is US$10.57...

Yahoo | May 13, 2023

United-Guardian Reports First Quarter Financial Results

HAUPPAUGE, N.Y., May 11, 2023 (GLOBE NEWSWIRE) -- United-Guardian, Inc. (NASDAQ:UG) today announced financial results for the first quarter of fiscal year 2023, which ended on March 31, 2023. Net sales decreased 34% compared to the prior year’s first quarter, decreasing from $3,892,358 to $2,570,324. Net income for the quarter decreased by 17% from $911,465 ($0.20 per share) in 2022 to $756,081 ($0.16 per share) this year. Beatriz Blanco, President of United-Guardian, stated, “The first quarter

Yahoo | May 11, 2023

United-Guardian Reports 2022 Financial Results

HAUPPAUGE, N.Y., March 17, 2023 (GLOBE NEWSWIRE) -- United-Guardian, Inc. (NASDAQ:UG) reported that net income for FY 2022 decreased by 45% compared to FY 2021. Net sales for the year decreased by 9% from $13,929,629 in 2021 to $12,698,503 in 2022, generating net income of $2,569,512 ($0.56 per share) in 2022 compared to $4,658,542 ($1.01 per share) in 2021. Beatriz Blanco, President of United-Guardian, stated, “The decrease in the Company’s net income was primarily caused by a decrease in reven

Yahoo | March 17, 2023

Is The Market Rewarding United-Guardian, Inc. (NASDAQ:UG) With A Negative Sentiment As A Result Of Its Mixed Fundamentals?

United-Guardian (NASDAQ:UG) has had a rough three months with its share price down 13%. We, however decided to study...

Yahoo | January 13, 2023

Read More 'UG' Stories Here

UG Price Returns

1-mo -2.69%
3-mo -14.04%
6-mo -19.01%
1-year -49.91%
3-year -33.58%
5-year -40.06%
YTD -13.51%
2022 -33.44%
2021 22.24%
2020 -23.31%
2019 13.20%
2018 4.98%

UG Dividends

Ex-Dividend Date Type Payout Amount Change
Loading, please wait...
View Full UG Dividend History

Continue Researching UG

Here are a few links from around the web to help you further your research on United Guardian Inc's stock as an investment opportunity:

United Guardian Inc (UG) Stock Price | Nasdaq
United Guardian Inc (UG) Stock Quote, History and News - Yahoo Finance
United Guardian Inc (UG) Stock Price and Basic Information | MarketWatch

Get Free Updates

Join thousands of investors who get the latest news, insights and top rated picks from StockNews.com!