
UGI Corporation (UGI): Price and Financial Metrics
UGI Price/Volume Stats
| Current price | $24.64 | 52-week high | $27.77 |
| Prev. close | $24.49 | 52-week low | $20.19 |
| Day low | $24.54 | Volume | 1,302,105 |
| Day high | $24.74 | Avg. volume | 2,268,845 |
| 50-day MA | $23.64 | Dividend yield | 6.19% |
| 200-day MA | $23.50 | Market Cap | 5.17B |
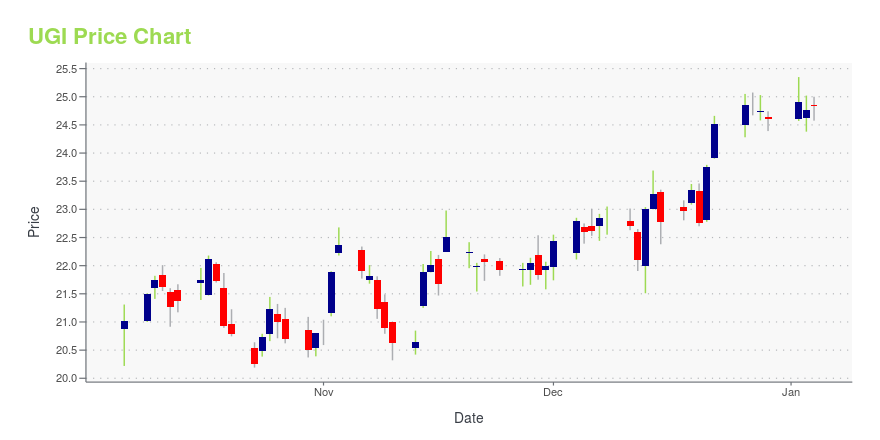
UGI Stock Price Chart Interactive Chart >
UGI Corporation (UGI) Company Bio
UGI Corporation operates natural gas and electric utilities in Pennsylvania, distributes propane both domestically and internationally, manages midstream energy and electric generation assets in Pennsylvania, and engages in energy marketing in the Mid-Atlantic region. The company was founded in 1882 and is based in King of Prussia, Pennsylvania.
Latest UGI News From Around the Web
Below are the latest news stories about UGI CORP that investors may wish to consider to help them evaluate UGI as an investment opportunity.
UGI Corporation Announces Leadership TransitionVALLEY FORGE, Pa., December 12, 2023--UGI Corporation (NYSE: UGI) (the "Company") announced today that Mario Longhi, incoming Chair of the Board of Directors, has been named interim Chief Executive Officer. Roger Perreault has stepped down as President and Chief Executive Officer and as a member of the Board, effective immediately. |
We Wouldn't Be Too Quick To Buy UGI Corporation (NYSE:UGI) Before It Goes Ex-DividendIt looks like UGI Corporation ( NYSE:UGI ) is about to go ex-dividend in the next four days. The ex-dividend date... |
Energy Sector Caution: 3 Natural Gas Stocks Not Worth HoldingThe gloomy market outlook is taking a financial toll on energy companies, especially for these three natural gas stocks to sell. |
12 Best Dividend Stocks Paying Over 6%In this article, we discuss 12 best dividend stocks paying over 6%. You can skip our detailed analysis of dividend stocks and their performance in the past, and go directly to read 5 Best Dividend Stocks Paying Over 6%. Dividends are crucial in investing because they provide investors with consistent income. They have played a […] |
UGI Corporation (NYSE:UGI) Q4 2023 Earnings Call TranscriptUGI Corporation (NYSE:UGI) Q4 2023 Earnings Call Transcript November 17, 2023 Operator: Good day, and thank you for standing by. Welcome to the UGI Corporation’s Fourth Quarter 2023 Earnings Conference Call. At this time, all participants are in a listen-only mode. After the speaker’s presentation, there will be a question-and-answer session. [Operator instructions] Please be […] |
UGI Price Returns
| 1-mo | 7.46% |
| 3-mo | -1.27% |
| 6-mo | 9.76% |
| 1-year | -0.30% |
| 3-year | -39.06% |
| 5-year | -40.22% |
| YTD | 3.38% |
| 2023 | -29.83% |
| 2022 | -16.13% |
| 2021 | 35.43% |
| 2020 | -19.36% |
| 2019 | -13.24% |
UGI Dividends
| Ex-Dividend Date | Type | Payout Amount | Change | ||||||
|---|---|---|---|---|---|---|---|---|---|
| Loading, please wait... | |||||||||
Continue Researching UGI
Want to see what other sources are saying about Ugi Corp's financials and stock price? Try the links below:Ugi Corp (UGI) Stock Price | Nasdaq
Ugi Corp (UGI) Stock Quote, History and News - Yahoo Finance
Ugi Corp (UGI) Stock Price and Basic Information | MarketWatch
Loading social stream, please wait...