UNITIL Corporation (UTL): Price and Financial Metrics
GET POWR RATINGS... FREE!
UTL POWR Grades
- UTL scores best on the Momentum dimension, with a Momentum rank ahead of 88.94% of US stocks.
- UTL's strongest trending metric is Quality; it's been moving down over the last 177 days.
- UTL ranks lowest in Quality; there it ranks in the 42nd percentile.
UTL Stock Summary
- With a one year PEG ratio of 237.4, UNITIL CORP is expected to have a higher PEG ratio (a measure of how expensive a stock is relative to its expected earnings growth) than 89.59% of US stocks.
- Of note is the ratio of UNITIL CORP's sales and general administrative expense to its total operating expenses; merely 0.48% of US stocks have a lower such ratio.
- In terms of volatility of its share price, UTL is more volatile than just 9.24% of stocks we're observing.
- Stocks with similar financial metrics, market capitalization, and price volatility to UNITIL CORP are MGEE, SB, VNOM, KNOP, and PAC.
- Visit UTL's SEC page to see the company's official filings. To visit the company's web site, go to unitil.com.
UTL Valuation Summary
- In comparison to the median Utilities stock, UTL's price/sales ratio is 40.74% lower, now standing at 1.6.
- Over the past 243 months, UTL's price/earnings ratio has gone down 6.
Below are key valuation metrics over time for UTL.
Stock | Date | P/S | P/B | P/E | EV/EBIT |
---|---|---|---|---|---|
UTL | 2023-01-13 | 1.6 | 1.9 | 20.6 | 18.2 |
UTL | 2023-01-12 | 1.6 | 1.9 | 20.6 | 18.2 |
UTL | 2023-01-11 | 1.6 | 1.8 | 20.3 | 18.0 |
UTL | 2023-01-10 | 1.5 | 1.8 | 20.0 | 17.8 |
UTL | 2023-01-09 | 1.5 | 1.8 | 20.1 | 17.9 |
UTL | 2023-01-06 | 1.6 | 1.8 | 20.3 | 18.0 |
UTL Growth Metrics
- Its 3 year net cashflow from operations growth rate is now at 1.48%.
- Its 2 year net cashflow from operations growth rate is now at -6.11%.
- Its 5 year net income to common stockholders growth rate is now at 15.03%.

The table below shows UTL's growth in key financial areas (numbers in millions of US dollars).
Date | Revenue | Operating Cash Flow | Net Income to Common Stock |
---|---|---|---|
2022-09-30 | 541.5 | 94.6 | 41.4 |
2022-06-30 | 529.4 | 94.4 | 40.9 |
2022-03-31 | 527.1 | 89.2 | 38.7 |
2021-12-31 | 473.3 | 107.8 | 36.1 |
2021-09-30 | 450.4 | 96.7 | 35.2 |
2021-06-30 | 439.7 | 101.8 | 35.5 |
UTL's Quality Factors
The “Quality” component of the POWR Ratings focuses on 31 different factors of a companies fundamentals and operational strength. Here are some key insights as we drill into the specifics of these quality attributes.- UTL has a Quality Grade of C, ranking ahead of 25.73% of graded US stocks.
- UTL's asset turnover comes in at 0.303 -- ranking 24th of 105 Utilities stocks.
- ALE, CPK, and BKH are the stocks whose asset turnover ratios are most correlated with UTL.
The table below shows UTL's key quality metrics over time.
Period | Asset Turnover | Gross Margin | ROIC |
---|---|---|---|
2021-09-30 | 0.303 | 0.354 | 0.038 |
2021-06-30 | 0.300 | 0.359 | 0.038 |
2021-03-31 | 0.296 | 0.367 | 0.039 |
2020-12-31 | 0.296 | 0.358 | 0.036 |
2020-09-30 | 0.301 | 0.348 | 0.036 |
2020-06-30 | 0.306 | 0.354 | 0.038 |
UTL Price Target
For more insight on analysts targets of UTL, see our UTL price target page. And for a list of of all stocks sorted by upside potential based on analyst target price, see our Top Price Target page.
Average Price Target | $53.67 | Average Broker Recommendation | 1.83 (Hold) |
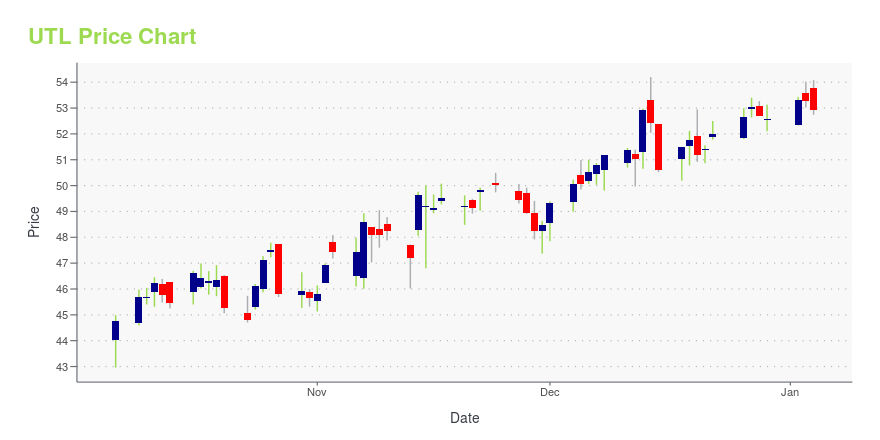
UTL Stock Price Chart Interactive Chart >
UTL Price/Volume Stats
Current price | $51.05 | 52-week high | $61.10 |
Prev. close | $51.06 | 52-week low | $44.67 |
Day low | $50.77 | Volume | 49,000 |
Day high | $51.72 | Avg. volume | 50,374 |
50-day MA | $51.98 | Dividend yield | 3.06% |
200-day MA | $52.94 | Market Cap | 818.84M |
UNITIL Corporation (UTL) Company Bio
Unitil Corporation distributes electricity in New Hampshire and Massachusetts and natural gas in New Hampshire, Maine, and Massachusetts. The company was founded in 1984 and is based in Hampton, New Hampshire.
Latest UTL News From Around the Web
Below are the latest news stories about UNITIL CORP that investors may wish to consider to help them evaluate UTL as an investment opportunity.
Is Unitil Corporation's (NYSE:UTL) 9.0% ROE Better Than Average?Many investors are still learning about the various metrics that can be useful when analysing a stock. This article is... |
Unitil''s Return On Capital Employed InsightsAccording to Benzinga Pro data Unitil (NYSE: UTL ) posted a 89.8% decrease in earnings from Q2. Sales, however, increased by 11.43% over the previous quarter to $110.20 million. Despite the increase in sales this quarter, the decrease in earnings may suggest Unitil is not utilizing their capital as effectively as possible. Unitil earned $4.90 million, and sales totaled $98.90 million in Q2. What Is Return On Capital Employed? Earnings data without context is not clear and can be difficult to base trading decisions on. Return on Capital Employed (ROCE) helps to filter signal from noise by measuring yearly pre-tax profit … Full story available on Benzinga.com |
UNITIL Corporation – Consensus Indicates Potential 5.7% UpsideUNITIL Corporation found using ticker (UTL) have now 3 analysts covering the stock. The analyst consensus points to a rating of ''Hold''. The range between the high target price and low target price is between 64 and 48 calculating the average target price we see 54.67. Given that the stocks previous close was at 51.74 this would indicate that there is a potential upside of 5.7%. There is a 50 day moving average of 50.02 and the 200 moving average now moves to 52.38. The company has a market capitalisation of $841m. Company Website: https://unitil.com [stock_market_widget type="chart" template="basic" color="green" assets="UTL" range="6mo" interval="1d" axes="true" cursor="true" api="yf"] The potential market cap would be $888m based on the market concensus. Unitil Corporation, a public... |
Unitil's (NYSE:UTL) investors will be pleased with their 25% return over the last yearIf you want to compound wealth in the stock market, you can do so by buying an index fund. But one can do better than... |
Unitil Reports Third Quarter EarningsHAMPTON, N.H., Nov. 01, 2022 (GLOBE NEWSWIRE) -- Unitil Corporation (NYSE: UTL) ( unitil.com ) today announced Net Income of $0.5 million, or $0.03 in Earnings Per Share (EPS) for the third quarter of 2022, an increase of $0.5 million in Net Income, or $0.03 in EPS, compared to the third quarter of 2021. For the nine months ended September 30, 2022, the Company reported Net Income of $26.9 million, or $1.68 per share, an increase of $5.3 million, or $0.26 per share, compared to the same nine month period in 2021. The Company’s Electric and Gas GAAP Gross Margins for the third quarter of 2022 were $21.5 million and $10.9 million, respectively. For the nine months ended September 30, 2022, the Company’s Electric and Gas GAAP Gross Margins were $57.3 million and $73.7 million, respectively. |
UTL Price Returns
1-mo | -0.60% |
3-mo | -0.92% |
6-mo | -4.41% |
1-year | 12.86% |
3-year | -8.26% |
5-year | 37.12% |
YTD | -0.60% |
2022 | 15.90% |
2021 | 7.31% |
2020 | -25.94% |
2019 | 25.30% |
2018 | 14.48% |
UTL Dividends
Ex-Dividend Date | Type | Payout Amount | Change | ||||||
---|---|---|---|---|---|---|---|---|---|
Loading, please wait... |
Continue Researching UTL
Here are a few links from around the web to help you further your research on Unitil Corp's stock as an investment opportunity:Unitil Corp (UTL) Stock Price | Nasdaq
Unitil Corp (UTL) Stock Quote, History and News - Yahoo Finance
Unitil Corp (UTL) Stock Price and Basic Information | MarketWatch
Loading social stream, please wait...