
Energy Fuels Inc. (UUUU): Price and Financial Metrics
UUUU Price/Volume Stats
| Current price | $5.67 | 52-week high | $9.02 |
| Prev. close | $5.60 | 52-week low | $5.16 |
| Day low | $5.52 | Volume | 1,815,636 |
| Day high | $5.71 | Avg. volume | 2,936,565 |
| 50-day MA | $6.18 | Dividend yield | N/A |
| 200-day MA | $6.76 | Market Cap | 914.41M |
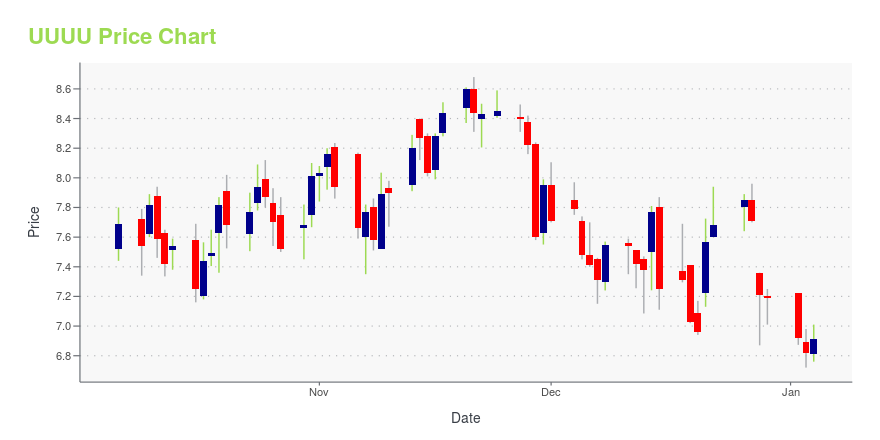
UUUU Stock Price Chart Interactive Chart >
Energy Fuels Inc. (UUUU) Company Bio
Energy Fuels Inc. engages in the extraction, recovery, and sale of uranium and vanadium properties in the United States. The company operates in two segments, ISR Uranium and Conventional Uranium. The company was founded in 1987 and is based in Lakewood, Colorado.
Latest UUUU News From Around the Web
Below are the latest news stories about ENERGY FUELS INC that investors may wish to consider to help them evaluate UUUU as an investment opportunity.
Energy Fuels (UUUU), Astorn Sign MOU to Develop Donald ProjectEnergy Fuels (UUUU) inks MOU with Astorn to co-develop the Donald Project in Australia. |
Energy Fuels Enters into MOU to Secure Near-Term, Large-Scale Australian Source of Rare Earth Minerals to Supply New U.S.-Based Supply Chain for DecadesEnergy Fuels Inc. (NYSE American: UUUU) (TSX: EFR) ("Energy Fuels" or the "Company"), a leading U.S. producer of uranium, rare earth elements ("REE"), and vanadium, is pleased to announce that it has entered into a non-binding Memorandum of Understanding ("MOU") with Astron Corporation Limited ("Astron") to jointly develop the Donald Rare Earth and Mineral Sands Project, located in the Wimmera Region of the State of Victoria, Australia (the "Donald Project"). The MOU describes indicative commerc |
Energy Fuels (UUUU) Commences Production at Three Uranium MinesEnergy Fuels (UUUU) starts production at three of its uranium mines, influenced by the uranium price hike. |
Energy Fuels starts production at three uranium mines as metal prices riseU.S.-based Energy Fuels said on Thursday it had started production at three of its permitted and developed uranium mines in Arizona and Utah, encouraged by higher prices of the heavy metal. The company is also preparing two more mines in Colorado and Wyoming for expected production within a year and advancing permitting on several other large-scale U.S. mine projects to increase uranium production in the coming years. "Due to the substantial increase in uranium prices, U.S. government support for nuclear energy and nuclear fuel, and a global focus on reducing carbon-emissions, Energy Fuels is resuming large-scale uranium production," CEO Mark Chalmers said in a statement. |
In Response to Surging Prices, Supportive Government Policies, and a Domestic Focus on Security of Supply, Energy Fuels Has Commenced Production at Three of its U.S. Uranium MinesEnergy Fuels Inc. (NYSE American: UUUU) (TSX: EFR) ("Energy Fuels" or the "Company"), a leading U.S. producer of uranium, rare earth elements ("REE"), and vanadium, is pleased to announce that, in response to strong uranium market conditions, it has commenced uranium production at three (3) of its permitted and developed uranium mines located in Arizona and Utah. In addition, the Company is preparing two (2) additional mines in Colorado and Wyoming for expected production within one (1) year and |
UUUU Price Returns
| 1-mo | -3.08% |
| 3-mo | 5.00% |
| 6-mo | -22.33% |
| 1-year | -3.41% |
| 3-year | 12.50% |
| 5-year | 196.86% |
| YTD | -21.14% |
| 2023 | 15.78% |
| 2022 | -18.61% |
| 2021 | 79.11% |
| 2020 | 123.04% |
| 2019 | -32.98% |
Continue Researching UUUU
Here are a few links from around the web to help you further your research on Energy Fuels Inc's stock as an investment opportunity:Energy Fuels Inc (UUUU) Stock Price | Nasdaq
Energy Fuels Inc (UUUU) Stock Quote, History and News - Yahoo Finance
Energy Fuels Inc (UUUU) Stock Price and Basic Information | MarketWatch
Loading social stream, please wait...