UNIVERSAL INSURANCE HOLDINGS INC (UVE): Price and Financial Metrics
UVE Price/Volume Stats
Current price | $16.23 | 52-week high | $20.15 |
Prev. close | $16.38 | 52-week low | $8.39 |
Day low | $16.08 | Volume | 122,827 |
Day high | $16.42 | Avg. volume | 247,852 |
50-day MA | $16.87 | Dividend yield | 4.19% |
200-day MA | $13.33 | Market Cap | 494.04M |
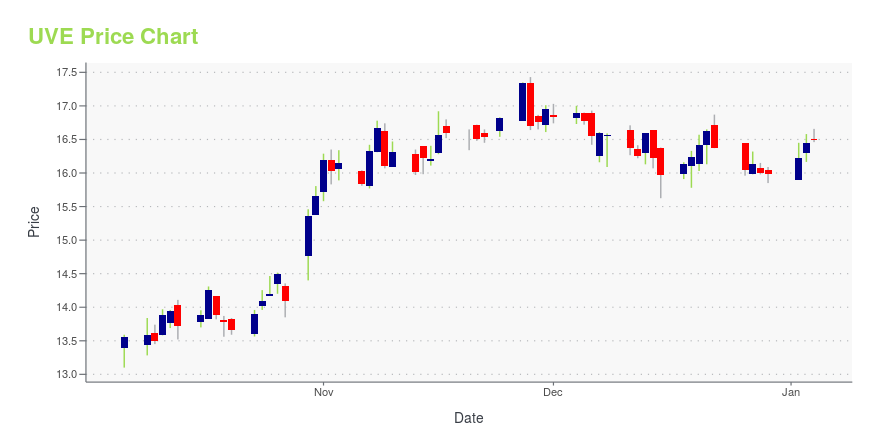
UVE Stock Price Chart Interactive Chart >
UVE POWR Grades
- Growth is the dimension where UVE ranks best; there it ranks ahead of 93.67% of US stocks.
- UVE's strongest trending metric is Growth; it's been moving up over the last 179 days.
- UVE's current lowest rank is in the Stability metric (where it is better than 55.17% of US stocks).
UVE Stock Summary
- Price to trailing twelve month operating cash flow for UVE is currently 1.53, higher than just 6.43% of US stocks with positive operating cash flow.
- Equity multiplier, or assets relative to shareholders' equity, comes in at 8.85 for UNIVERSAL INSURANCE HOLDINGS INC; that's greater than it is for 87.67% of US stocks.
- Over the past twelve months, UVE has reported earnings growth of -163.75%, putting it ahead of merely 9.81% of US stocks in our set.
- Stocks with similar financial metrics, market capitalization, and price volatility to UNIVERSAL INSURANCE HOLDINGS INC are THFF, SBH, LAZ, CAL, and GPS.
- UVE's SEC filings can be seen here. And to visit UNIVERSAL INSURANCE HOLDINGS INC's official web site, go to www.universalinsuranceholdings.com.
UVE Valuation Summary
- UVE's price/sales ratio is 0.4; this is 81.82% lower than that of the median Financial Services stock.
- UVE's price/earnings ratio has moved down 50.7 over the prior 243 months.
Below are key valuation metrics over time for UVE.
Stock | Date | P/S | P/B | P/E | EV/EBIT |
---|---|---|---|---|---|
UVE | 2023-05-19 | 0.4 | 1.5 | -30.7 | -31.8 |
UVE | 2023-05-18 | 0.4 | 1.5 | -30.7 | -31.8 |
UVE | 2023-05-17 | 0.4 | 1.5 | -30.9 | -32.1 |
UVE | 2023-05-16 | 0.4 | 1.5 | -30.6 | -31.6 |
UVE | 2023-05-15 | 0.4 | 1.5 | -30.2 | -31.0 |
UVE | 2023-05-12 | 0.4 | 1.5 | -30.3 | -31.2 |
UVE Growth Metrics
- The 2 year price growth rate now stands at -28.23%.
- Its 3 year revenue growth rate is now at 31.96%.
- The 5 year net cashflow from operations growth rate now stands at -33.99%.

The table below shows UVE's growth in key financial areas (numbers in millions of US dollars).
Date | Revenue | Operating Cash Flow | Net Income to Common Stock |
---|---|---|---|
2022-09-30 | 1,184.957 | 183.555 | -95.493 |
2022-09-30 | 1,184.957 | 183.555 | -95.493 |
2022-06-30 | 1,159.401 | 202.682 | -3.035 |
2022-03-31 | 1,146.576 | 146.032 | 11.536 |
2021-12-31 | 1,121.851 | 234.378 | 20.407 |
2021-09-30 | 1,102.318 | 129.783 | 50.857 |
UVE's Quality Factors
The “Quality” component of the POWR Ratings focuses on 31 different factors of a companies fundamentals and operational strength. Here are some key insights as we drill into the specifics of these quality attributes.- UVE has a Quality Grade of C, ranking ahead of 67.31% of graded US stocks.
- UVE's asset turnover comes in at 0.554 -- ranking 24th of 133 Insurance stocks.
- UNH, FGF, and AFHIF are the stocks whose asset turnover ratios are most correlated with UVE.
The table below shows UVE's key quality metrics over time.
Period | Asset Turnover | Gross Margin | ROIC |
---|---|---|---|
2021-09-30 | 0.554 | 0.335 | 0.036 |
2021-06-30 | 0.573 | 0.305 | 0.020 |
2021-03-31 | 0.581 | 0.302 | 0.020 |
2020-12-31 | 0.580 | 0.293 | 0.015 |
2020-09-30 | 0.565 | 0.260 | -0.011 |
2020-06-30 | 0.536 | 0.307 | 0.009 |
UVE Price Target
For more insight on analysts targets of UVE, see our UVE price target page. And for a list of of all stocks sorted by upside potential based on analyst target price, see our Top Price Target page.
Average Price Target | $15.00 | Average Broker Recommendation | 2 (Hold) |
UNIVERSAL INSURANCE HOLDINGS INC (UVE) Company Bio
Universal Insurance Holdings, Inc. provides various property and casualty insurance products. The company primarily underwrites homeowners insurance products; and offers reinsurance intermediary brokerage services. The company was founded in 1990 and is based in Fort Lauderdale, Florida.
Latest UVE News From Around the Web
Below are the latest news stories about UNIVERSAL INSURANCE HOLDINGS INC that investors may wish to consider to help them evaluate UVE as an investment opportunity.
Should Value Investors Buy Universal Insurance Holdings (UVE) Stock?Here at Zacks, our focus is on the proven Zacks Rank system, which emphasizes earnings estimates and estimate revisions to find great stocks. Nevertheless, we are always paying attention to the latest value, growth, and momentum trends to underscore strong picks. |
Universal’s Insurance Subsidiaries Complete 2023-2024 Reinsurance ProgramFORT LAUDERDALE, Fla., May 30, 2023--Universal Insurance Holdings, Inc. (NYSE: UVE)("Universal" or the "Company") today announced the completion by Universal Property & Casualty Insurance Company ("UPCIC") and American Platinum Property and Casualty Insurance Company ("APPCIC"), the Company’s wholly-owned insurance company subsidiaries, of their combined 2023-2024 reinsurance program, effective June 1, 2023. |
MetLife (MET) Unveils Reinsurance Deal With Global AtlanticMetLife (MET) inscribes a deal to transfer risks related to its U.S. retail life insurance and fixed annuity products to Global Atlantic. It also announces a $1 billion buyback capacity increase. |
3 Small-Caps Tailored for Growth InvestorsWhile small caps are typically more volatile, their growth potential is challenging to ignore. For those with a less-conservative approach, these three could be great watchlist additions. |
Is Manulife Financial Corp (MFC) Outperforming Other Finance Stocks This Year?Here is how Manulife Financial (MFC) and Universal Insurance Holdings (UVE) have performed compared to their sector so far this year. |
UVE Price Returns
1-mo | 4.69% |
3-mo | -13.44% |
6-mo | 47.61% |
1-year | 37.40% |
3-year | -3.40% |
5-year | -44.74% |
YTD | 56.11% |
2022 | -33.52% |
2021 | 18.39% |
2020 | -43.50% |
2019 | -24.24% |
2018 | 41.44% |
UVE Dividends
Ex-Dividend Date | Type | Payout Amount | Change | ||||||
---|---|---|---|---|---|---|---|---|---|
Loading, please wait... |
Continue Researching UVE
Want to do more research on Universal Insurance Holdings Inc's stock and its price? Try the links below:Universal Insurance Holdings Inc (UVE) Stock Price | Nasdaq
Universal Insurance Holdings Inc (UVE) Stock Quote, History and News - Yahoo Finance
Universal Insurance Holdings Inc (UVE) Stock Price and Basic Information | MarketWatch
Loading social stream, please wait...