
Value Line, Inc. (VALU): Price and Financial Metrics
VALU Price/Volume Stats
| Current price | $49.71 | 52-week high | $62.09 |
| Prev. close | $49.51 | 52-week low | $32.07 |
| Day low | $48.51 | Volume | 2,930 |
| Day high | $51.00 | Avg. volume | 3,900 |
| 50-day MA | $42.16 | Dividend yield | 2.57% |
| 200-day MA | $41.83 | Market Cap | 468.52M |
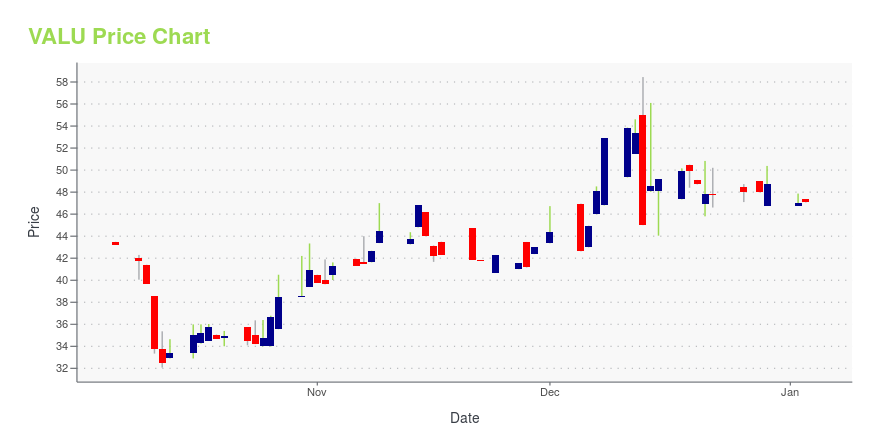
VALU Stock Price Chart Interactive Chart >
Value Line, Inc. (VALU) Company Bio
Value Line, Inc. produces and sells investment periodicals and related publications primarily in the United States. Its investment periodicals and related publications cover a range of investments, including stocks, mutual funds, exchange traded funds (ETFs), options, and convertible securities. The company was founded in 1931 and is based in New York, New York.
Latest VALU News From Around the Web
Below are the latest news stories about VALUE LINE INC that investors may wish to consider to help them evaluate VALU as an investment opportunity.
Investing in Value Line (NASDAQ:VALU) five years ago would have delivered you a 133% gainThe worst result, after buying shares in a company (assuming no leverage), would be if you lose all the money you put... |
VALU Stock Earnings: Value Line Reported Results for Q2 2024Value Line just reported results for the second quarter of 2024. |
VALUE LINE, INC. ANNOUNCES SECOND QUARTER EARNINGSNEW YORK, Dec. 15, 2023 (GLOBE NEWSWIRE) -- Value Line, Inc., (NASDAQ: VALU) reported financial results for the second fiscal quarter ended October 31, 2023. Retained earnings at October 31, 2023, were $99,046,000, an increase of 3.2% compared to retained earnings at April 30, 2023. Shareholders’ equity reached $85,742,000 at October 31, 2023, an increase of 2.5% from the shareholders’ equity of $83,673,000 as of April 30, 2023. During the six months ended October 31, 2023, the Company’s net inc |
Value Line Inc's Dividend AnalysisValue Line Inc (NASDAQ:VALU) recently announced a dividend of $0.28 per share, payable on 2023-11-09, with the ex-dividend date set for 2023-10-27. As investors look forward to this upcoming payment, the spotlight also shines on the company's dividend history, yield, and growth rates. Using the data from GuruFocus, let's delve into Value Line Inc's dividend performance and assess its sustainability. |
VALUE LINE, INC. DECLARES A QUARTERLY CASH DIVIDEND OF $0.28 PER COMMON SHARENEW YORK, Oct. 20, 2023 (GLOBE NEWSWIRE) -- Value Line, Inc. (NASDAQ: VALU) announced today that its Board of Directors declared on October 20, 2023 a quarterly cash dividend of $0.28 per common share, payable on November 9, 2023, to stockholders of record on October 30, 2023. The Company has 9,427,552 shares of common stock outstanding as of October 20, 2023. Value Line, Inc. is a leading New York based provider of investment research. The Value Line Investment Survey is one of the most widely |
VALU Price Returns
| 1-mo | 19.75% |
| 3-mo | 36.75% |
| 6-mo | 13.41% |
| 1-year | -11.16% |
| 3-year | 62.03% |
| 5-year | 103.54% |
| YTD | 3.48% |
| 2023 | -1.94% |
| 2022 | 10.35% |
| 2021 | 45.98% |
| 2020 | 17.42% |
| 2019 | 15.09% |
VALU Dividends
| Ex-Dividend Date | Type | Payout Amount | Change | ||||||
|---|---|---|---|---|---|---|---|---|---|
| Loading, please wait... | |||||||||
Continue Researching VALU
Here are a few links from around the web to help you further your research on Value Line Inc's stock as an investment opportunity:Value Line Inc (VALU) Stock Price | Nasdaq
Value Line Inc (VALU) Stock Quote, History and News - Yahoo Finance
Value Line Inc (VALU) Stock Price and Basic Information | MarketWatch
Loading social stream, please wait...