Vericel Corporation (VCEL): Price and Financial Metrics
VCEL Price/Volume Stats
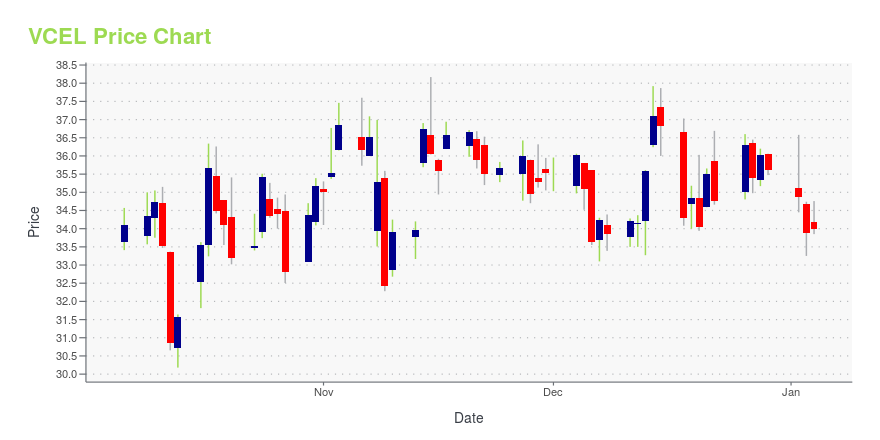
Current price | $34.55 | 52-week high | $35.73 |
Prev. close | $34.08 | 52-week low | $17.30 |
Day low | $33.84 | Volume | 355,700 |
Day high | $35.05 | Avg. volume | 340,961 |
50-day MA | $31.73 | Dividend yield | N/A |
200-day MA | $27.51 | Market Cap | 1.64B |
VCEL Stock Price Chart Interactive Chart >
VCEL POWR Grades
- Quality is the dimension where VCEL ranks best; there it ranks ahead of 72.35% of US stocks.
- The strongest trend for VCEL is in Growth, which has been heading up over the past 179 days.
- VCEL's current lowest rank is in the Sentiment metric (where it is better than 10.46% of US stocks).
VCEL Stock Summary
- The price/operating cash flow metric for VERICEL CORP is higher than 95.3% of stocks in our set with a positive cash flow.
- With a price/sales ratio of 9.67, VERICEL CORP has a higher such ratio than 89.03% of stocks in our set.
- Equity multiplier, or assets relative to shareholders' equity, comes in at 1.4 for VERICEL CORP; that's greater than it is for merely 22.14% of US stocks.
- Stocks that are quantitatively similar to VCEL, based on their financial statements, market capitalization, and price volatility, are TNON, YOU, FLGT, FTCI, and SVFD.
- VCEL's SEC filings can be seen here. And to visit VERICEL CORP's official web site, go to vcel.com.
VCEL Valuation Summary
- In comparison to the median Healthcare stock, VCEL's price/sales ratio is 350% higher, now standing at 9.9.
- Over the past 243 months, VCEL's price/earnings ratio has gone down 93.1.
Below are key valuation metrics over time for VCEL.
Stock | Date | P/S | P/B | P/E | EV/EBIT |
---|---|---|---|---|---|
VCEL | 2023-05-23 | 9.9 | 8.6 | -97.8 | -104.3 |
VCEL | 2023-05-22 | 9.7 | 8.5 | -95.9 | -102.3 |
VCEL | 2023-05-19 | 9.1 | 8.0 | -90.4 | -96.3 |
VCEL | 2023-05-18 | 9.3 | 8.1 | -91.6 | -97.6 |
VCEL | 2023-05-17 | 9.2 | 8.1 | -91.3 | -97.4 |
VCEL | 2023-05-16 | 9.3 | 8.1 | -91.9 | -98.0 |
VCEL Growth Metrics
- The 4 year net cashflow from operations growth rate now stands at 87.81%.
- Its 3 year net cashflow from operations growth rate is now at 3481.9%.
- Its year over year price growth rate is now at -45.13%.

The table below shows VCEL's growth in key financial areas (numbers in millions of US dollars).
Date | Revenue | Operating Cash Flow | Net Income to Common Stock |
---|---|---|---|
2022-12-31 | 164.365 | 17.687 | -16.709 |
2022-09-30 | 159.262 | 21.263 | -18.096 |
2022-06-30 | 155.217 | 20.796 | -16.45 |
2022-03-31 | 157.69 | 22.422 | -11.273 |
2021-12-31 | 156.184 | 29.04 | -7.471 |
2021-09-30 | 153.822 | 29.826 | 0.214 |
VCEL's Quality Factors
The “Quality” component of the POWR Ratings focuses on 31 different factors of a companies fundamentals and operational strength. Here are some key insights as we drill into the specifics of these quality attributes.- VCEL has a Quality Grade of C, ranking ahead of 72.89% of graded US stocks.
- VCEL's asset turnover comes in at 0.761 -- ranking 35th of 682 Pharmaceutical Products stocks.
- TCON, NMTR, and PTCT are the stocks whose asset turnover ratios are most correlated with VCEL.
The table below shows VCEL's key quality metrics over time.
Period | Asset Turnover | Gross Margin | ROIC |
---|---|---|---|
2021-06-30 | 0.761 | 0.699 | 0.052 |
2021-03-31 | 0.732 | 0.685 | 0.031 |
2020-12-31 | 0.753 | 0.678 | 0.023 |
2020-09-30 | 0.779 | 0.671 | 0.001 |
2020-06-30 | 0.793 | 0.670 | 0.000 |
2020-03-31 | 0.866 | 0.683 | -0.094 |
VCEL Price Target
For more insight on analysts targets of VCEL, see our VCEL price target page. And for a list of of all stocks sorted by upside potential based on analyst target price, see our Top Price Target page.
Average Price Target | $65.04 | Average Broker Recommendation | 1.29 (Strong Buy) |
Vericel Corporation (VCEL) Company Bio
Vericel Corporation focuses on developing patient-specific expanded cellular therapies for use in the treatment of patients with severe diseases and conditions. The company was founded in 1989 and is based in Cambridge, Massachusetts.
Latest VCEL News From Around the Web
Below are the latest news stories about VERICEL CORP that investors may wish to consider to help them evaluate VCEL as an investment opportunity.
Vericel Corporation (VCEL) Reports Q1 Loss, Tops Revenue EstimatesVericel Corporation (VCEL) delivered earnings and revenue surprises of -23.08% and 6.68%, respectively, for the quarter ended March 2023. Do the numbers hold clues to what lies ahead for the stock? |
Vericel Reports First Quarter 2023 Financial Results and Raises Full-Year 2023 Financial GuidanceRecord First Quarter Total Revenue of $41 Million MACI Revenue Increased 32% to $34.2 Million Full-Year 2023 Revenue Guidance Raised to $184-$192 Million Conference Call Today at 8:30am Eastern Time CAMBRIDGE, Mass., May 10, 2023 (GLOBE NEWSWIRE) -- Vericel Corporation (NASDAQ:VCEL), a leader in advanced therapies for the sports medicine and severe burn care markets, today reported financial results and business highlights for the first quarter ended March 31, 2023, and provided updated full-yea |
Dimension Inx announces the addition of biotech industry leaders Paul K. Wotton, Ph.D., as Board Director and Chris Ehrlich as Senior AdvisorDimension Inx, a biomaterials platform company developing therapeutics that restore tissue and organ function, announced today the appointments of Paul K. Wotton, Ph.D., to the board of directors and Chris Ehrlich as Senior Advisor. |
Vericel to Report First-Quarter 2023 Financial Results on May 10, 2023CAMBRIDGE, Mass., April 26, 2023 (GLOBE NEWSWIRE) -- Vericel Corporation (NASDAQ:VCEL), a leader in advanced therapies for the sports medicine and severe burn care markets, today announced that it will report its first-quarter 2023 financial results on Wednesday, May 10, 2023. Vericel’s management will host a conference call and webcast at 8:30 a.m. (ET) to discuss its financial results and business highlights. The live webcast can be accessed on the Investor Relations section of the Vericel web |
Allogene Therapeutics (ALLO) Surges 8.4%: Is This an Indication of Further Gains?Allogene Therapeutics (ALLO) was a big mover last session on higher-than-average trading volume. The latest trend in earnings estimate revisions might not help the stock continue moving higher in the near term. |
VCEL Price Returns
1-mo | 5.21% |
3-mo | 17.52% |
6-mo | 50.41% |
1-year | 28.20% |
3-year | 140.26% |
5-year | 162.74% |
YTD | 31.17% |
2022 | -32.98% |
2021 | 27.27% |
2020 | 77.47% |
2019 | 0.00% |
2018 | 219.27% |
Continue Researching VCEL
Here are a few links from around the web to help you further your research on Vericel Corp's stock as an investment opportunity:Vericel Corp (VCEL) Stock Price | Nasdaq
Vericel Corp (VCEL) Stock Quote, History and News - Yahoo Finance
Vericel Corp (VCEL) Stock Price and Basic Information | MarketWatch
Loading social stream, please wait...