
Valhi, Inc. (VHI): Price and Financial Metrics
VHI Price/Volume Stats
| Current price | $20.26 | 52-week high | $20.38 |
| Prev. close | $19.56 | 52-week low | $10.80 |
| Day low | $19.68 | Volume | 18,963 |
| Day high | $20.37 | Avg. volume | 9,485 |
| 50-day MA | $18.24 | Dividend yield | 1.75% |
| 200-day MA | $15.20 | Market Cap | 573.11M |
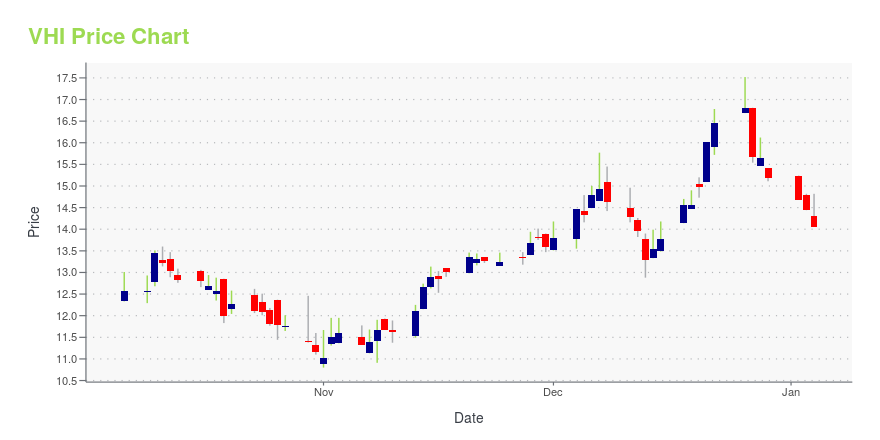
VHI Stock Price Chart Interactive Chart >
Valhi, Inc. (VHI) Company Bio
Valhi, Inc. engages in the chemicals, component products, waste management, and real estate businesses worldwide. The company was founded in 1932 and is based in Dallas, Texas.
Latest VHI News From Around the Web
Below are the latest news stories about VALHI INC that investors may wish to consider to help them evaluate VHI as an investment opportunity.
VALHI REPORTS THIRD QUARTER 2023 RESULTSDallas, Texas, Nov. 06, 2023 (GLOBE NEWSWIRE) -- Valhi, Inc. (NYSE: VHI) reported a net loss attributable to Valhi stockholders of $6.0 million, or $.21 per share, in the third quarter of 2023 compared to net income of $26.2 million, or $.92 per share, in the third quarter of 2022. For the first nine months of 2023, Valhi reported a net loss attributable to Valhi stockholders of $16.0 million, or $.56 per share, compared to net income of $99.6 million, or $3.49 per share, in the first nine month |
Valhi's (NYSE:VHI) Dividend Will Be $0.08Valhi, Inc.'s ( NYSE:VHI ) investors are due to receive a payment of $0.08 per share on 21st of December. This makes... |
Shareholders in Valhi (NYSE:VHI) are in the red if they invested a year agoPassive investing in an index fund is a good way to ensure your own returns roughly match the overall market. While... |
Valhi (NYSE:VHI) Is Due To Pay A Dividend Of $0.08Valhi, Inc.'s ( NYSE:VHI ) investors are due to receive a payment of $0.08 per share on 21st of September. This means... |
Valhi's (NYSE:VHI) Returns On Capital Tell Us There Is Reason To Feel UneasyTo avoid investing in a business that's in decline, there's a few financial metrics that can provide early indications... |
VHI Price Returns
| 1-mo | 17.93% |
| 3-mo | 35.65% |
| 6-mo | 39.70% |
| 1-year | 34.05% |
| 3-year | -15.73% |
| 5-year | -9.91% |
| YTD | 34.73% |
| 2023 | -29.43% |
| 2022 | -22.66% |
| 2021 | 91.70% |
| 2020 | -30.01% |
| 2019 | 0.36% |
VHI Dividends
| Ex-Dividend Date | Type | Payout Amount | Change | ||||||
|---|---|---|---|---|---|---|---|---|---|
| Loading, please wait... | |||||||||
Continue Researching VHI
Want to see what other sources are saying about Valhi Inc's financials and stock price? Try the links below:Valhi Inc (VHI) Stock Price | Nasdaq
Valhi Inc (VHI) Stock Quote, History and News - Yahoo Finance
Valhi Inc (VHI) Stock Price and Basic Information | MarketWatch
Loading social stream, please wait...