
Vornado Realty Trust (VNO): Price and Financial Metrics
VNO Price/Volume Stats
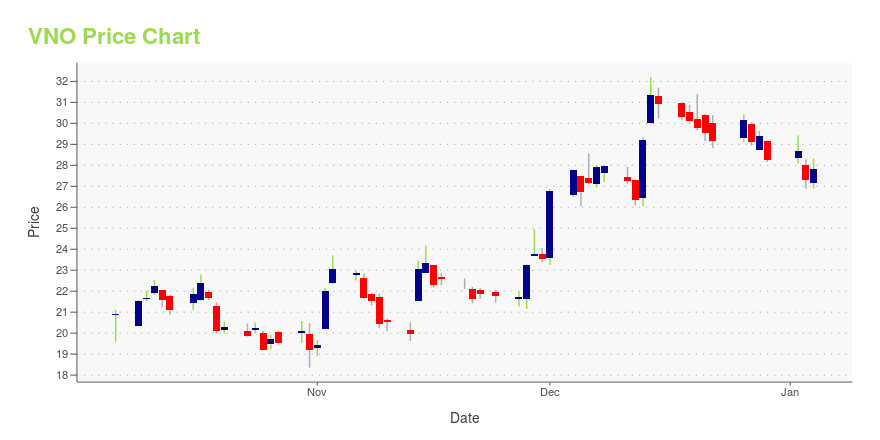
| Current price | $29.33 | 52-week high | $32.21 |
| Prev. close | $28.44 | 52-week low | $18.36 |
| Day low | $28.88 | Volume | 2,433,933 |
| Day high | $29.64 | Avg. volume | 2,009,549 |
| 50-day MA | $25.92 | Dividend yield | 1.02% |
| 200-day MA | $25.70 | Market Cap | 5.59B |
VNO Stock Price Chart Interactive Chart >
Vornado Realty Trust (VNO) Company Bio
Vornado Realty Trust is a real estate investment trust formed in Maryland in 1982, with its primary office in New York City. The company invests in office buildings and street retail in Manhattan. (Source:Wikipedia)
Latest VNO News From Around the Web
Below are the latest news stories about VORNADO REALTY TRUST that investors may wish to consider to help them evaluate VNO as an investment opportunity.
Envista cut to Sell at Goldman Sachs, CRISPR to Underperform: 4 big analyst cutsHere is your Pro Recap of the biggest analyst cuts you may have missed today: downgrades at Envista, CRISPR Therapeutics, Super Micro Computer, and Vornado Realty Trust. Envista (NYSE:NVST) shares dropped more than 2% pre-market today after Goldman Sachs downgraded the company to Sell from Neutral with a price target of $22.00. |
Vornado’s Debt Rating Downgraded to Junk Category by Moody’sVornado Realty Trust (VNO)’s debt and preferred stock ratings plunged into junk territory after a downgrade from Moody’s this week. Vornado’s earnings have fallen in proportion to its fixed charges, reaching a coverage ratio of 2.3 at the end of the third quarter of 2023, according to Moody’s. The new Ba1 rating indicates Vornado’s debt obligations pose “substantial credit risk,” and Moody’s predicted its coverage ratio will remain weak for the next one to two years. |
Vornado (VNO) Cuts Dividend by 20%, to Pay One Dividend in 2024Vornado (VNO) cuts its fourth-quarter dividend by 20% to 30 cents per common share, to focus on maintaining its retained cashflows and balance sheet strength. It expects to pay a single dividend in 2024. |
Moody’s downgrades Vornado’s debt rating to junkVornado’s Steven Roth with the Farley Building (Getty, Vornado Realty)Vornado Realty has been hit with a rating downgrade. Moody’s downgraded Vornado’s debt rating from investment grade to junk over the firm’s ability to make debt payments over the next two years, on Monday. Moody’s pointed to Vornado’s fixed charge coverage ratio, or its ability to pay debt costs, declining to […] |
Vornado Declares Common Dividend of $.30 Per ShareNEW YORK, Dec. 05, 2023 (GLOBE NEWSWIRE) -- Vornado Realty Trust (NYSE:VNO) announced today that its Board of Trustees has declared a dividend of $.30 per common share. The dividend will be payable on December 27, 2023 to shareholders of record on December 15, 2023. Together with the $.375 per share common dividend already paid in the first quarter of 2023, this results in an aggregate 2023 common dividend of $.675 per common share. Vornado anticipates that its common share dividend policy for 2 |
VNO Price Returns
| 1-mo | 17.41% |
| 3-mo | 11.69% |
| 6-mo | 1.42% |
| 1-year | 38.35% |
| 3-year | -25.17% |
| 5-year | -40.74% |
| YTD | 3.82% |
| 2023 | 39.50% |
| 2022 | -46.66% |
| 2021 | 17.78% |
| 2020 | -40.43% |
| 2019 | 14.93% |
VNO Dividends
| Ex-Dividend Date | Type | Payout Amount | Change | ||||||
|---|---|---|---|---|---|---|---|---|---|
| Loading, please wait... | |||||||||
Continue Researching VNO
Here are a few links from around the web to help you further your research on Vornado Realty Trust's stock as an investment opportunity:Vornado Realty Trust (VNO) Stock Price | Nasdaq
Vornado Realty Trust (VNO) Stock Quote, History and News - Yahoo Finance
Vornado Realty Trust (VNO) Stock Price and Basic Information | MarketWatch
Loading social stream, please wait...