Viper Energy Partners LP - Common Unit (VNOM): Price and Financial Metrics

Viper Energy Partners LP - Common Unit (VNOM): $27.63

0.37 (-1.32%)

POWR Rating

Component Grades

Momentum

B

Stability

C

Sentiment

Quality

A

Add VNOM to Watchlist
Sign Up

Industry: MLPs - Oil & Gas

Industry

A

Ranked

#14 of 26

in industry

VNOM Price/Volume Stats

Current price $27.63 52-week high $36.10
Prev. close $28.00 52-week low $24.48
Day low $27.54 Volume 273,500
Day high $28.22 Avg. volume 383,480
50-day MA $27.78 Dividend yield 3.87%
200-day MA $28.58 Market Cap 4.47B

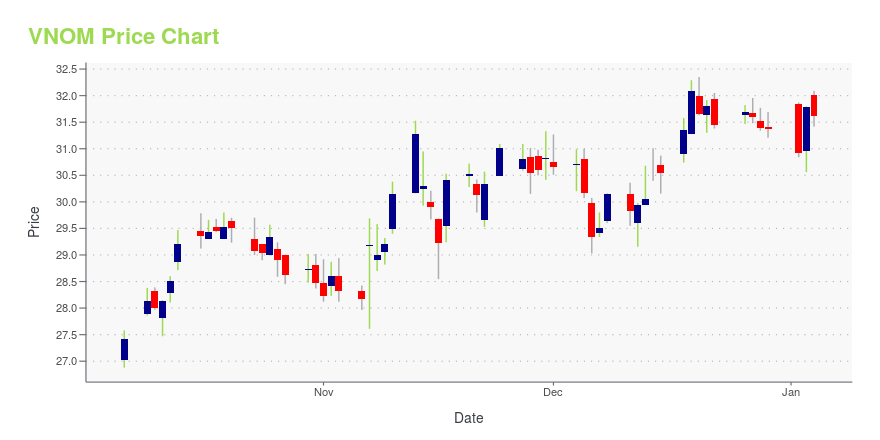
VNOM Stock Price Chart Interactive Chart >

VNOM POWR Grades

  • VNOM scores best on the Quality dimension, with a Quality rank ahead of 96.29% of US stocks.
  • The strongest trend for VNOM is in Growth, which has been heading down over the past 179 days.
  • VNOM ranks lowest in Growth; there it ranks in the 1st percentile.

VNOM Stock Summary

  • Of note is the ratio of VIPER ENERGY PARTNERS LP's sales and general administrative expense to its total operating expenses; merely 2.69% of US stocks have a lower such ratio.
  • For VNOM, its debt to operating expenses ratio is greater than that reported by 82.07% of US equities we're observing.
  • VNOM's price/sales ratio is 6.07; that's higher than the P/S ratio of 83.56% of US stocks.
  • Stocks that are quantitatively similar to VNOM, based on their financial statements, market capitalization, and price volatility, are OPI, CRK, SB, SBRA, and AIRC.
  • VNOM's SEC filings can be seen here. And to visit VIPER ENERGY PARTNERS LP's official web site, go to www.viperenergy.com.

VNOM Valuation Summary

  • In comparison to the median Energy stock, VNOM's price/sales ratio is 238.89% higher, now standing at 6.1.
  • VNOM's EV/EBIT ratio has moved NA NA over the prior 112 months.

Below are key valuation metrics over time for VNOM.

Stock Date P/S P/B P/E EV/EBIT
VNOM 2023-09-14 6.1 6.9 27.8 28.6
VNOM 2023-09-13 6.1 6.9 28.0 28.7
VNOM 2023-09-12 6.1 6.9 27.9 28.7
VNOM 2023-09-11 6.1 6.9 27.9 28.6
VNOM 2023-09-08 6.2 7.0 28.2 28.9
VNOM 2023-09-07 6.1 6.9 28.0 28.7

VNOM Growth Metrics

    Its 3 year net income to common stockholders growth rate is now at -42.48%.
  • The 5 year net income to common stockholders growth rate now stands at -491.89%.
  • Its 2 year net income to common stockholders growth rate is now at 159.82%.
Over the past 34 months, VNOM's revenue has gone up $551,082,000.

The table below shows VNOM's growth in key financial areas (numbers in millions of US dollars).

Date Revenue Operating Cash Flow Net Income to Common Stock
2022-12-31 866.467 699.796 151.673
2022-09-30 828.629 620.683 169.432
2022-06-30 735.016 476.454 106.924
2022-03-31 609.844 388.293 77.564
2021-12-31 504.917 307.114 57.939
2021-09-30 415.453 253.022 -9.145

VNOM's Quality Factors

The “Quality” component of the POWR Ratings focuses on 31 different factors of a companies fundamentals and operational strength. Here are some key insights as we drill into the specifics of these quality attributes.
  • VNOM has a Quality Grade of B, ranking ahead of 90.69% of graded US stocks.
  • VNOM's asset turnover comes in at 0.169 -- ranking 117th of 137 Petroleum and Natural Gas stocks.
  • DMLP, MPC, and AXAS are the stocks whose asset turnover ratios are most correlated with VNOM.

The table below shows VNOM's key quality metrics over time.

Period Asset Turnover Gross Margin ROIC
2021-09-30 0.169 0.930 0.008
2021-06-30 0.141 0.928 0.002
2021-03-31 0.106 0.924 -0.007
2020-12-31 0.097 0.921 -0.005
2020-09-30 0.100 0.923 0.005
2020-06-30 0.109 0.927 0.004

Viper Energy Partners LP - Common Unit (VNOM) Company Bio


Viper Energy Partners LP acquires, exploits, and develops oil and natural gas properties in the Permian Basin, West Texas and Delaware basins. The company was founded in 2013 and is based in Midland, Texas.


VNOM Latest News Stream


Event/Time News Detail
Loading, please wait...

VNOM Latest Social Stream


Loading social stream, please wait...

View Full VNOM Social Stream

Latest VNOM News From Around the Web

Below are the latest news stories about VIPER ENERGY PARTNERS LP that investors may wish to consider to help them evaluate VNOM as an investment opportunity.

The Zacks Analyst Blog Highlights Granite Ridge Resources, Viper Energy Partners, Evolution Petroleum and Northern Oil and Gas

Granite Ridge Resources, Viper Energy Partners, Evolution Petroleum and Northern Oil and Gas are included in this Analyst Blog.

Yahoo | September 14, 2023

Wall Street Analysts Believe Viper Energy (VNOM) Could Rally 28.26%: Here's is How to Trade

The mean of analysts' price targets for Viper Energy (VNOM) points to a 28.3% upside in the stock. While this highly sought-after metric has not proven reasonably effective, strong agreement among analysts in raising earnings estimates does indicate an upside in the stock.

Yahoo | September 13, 2023

BP CEO Bernard Looney Resigns Amid Transparency Controversy

BP CEO Looney resigns after not being transparent about past personal relationships with colleagues.

Yahoo | September 13, 2023

7 Dividend Stocks That Can Still Give You Capital Gains

Although dividend stocks tend to attractive conservative investors seeking passive income, these ideas also offer capital gains potential.

Josh Enomoto on InvestorPlace | September 11, 2023

Viper Energy Partners LP, a Subsidiary of Diamondback Energy, Inc., Announces Acquisition

MIDLAND, Texas, Sept. 05, 2023 (GLOBE NEWSWIRE) -- Viper Energy Partners LP (NASDAQ:VNOM) (“Viper” or the “Company”), a subsidiary of Diamondback Energy, Inc. (NASDAQ:FANG) (“Diamondback”), today announced it has entered into a definitive purchase and sale agreement to acquire certain mineral and royalty interests from affiliates of Warwick Capital Partners and GRP Energy Capital (collectively, the “Seller”) in exchange for approximately 9.02 million Viper common units and $750 million of cash,

Yahoo | September 5, 2023

Read More 'VNOM' Stories Here

VNOM Price Returns

1-mo 1.02%
3-mo 11.90%
6-mo 5.81%
1-year -1.32%
3-year 326.13%
5-year -10.38%
YTD -9.44%
2022 61.69%
2021 94.24%
2020 -50.69%
2019 0.66%
2018 19.60%

VNOM Dividends

Ex-Dividend Date Type Payout Amount Change
Loading, please wait...
View Full VNOM Dividend History

Get Free Updates

Join thousands of investors who get the latest news, insights and top rated picks from StockNews.com!