
Varex Imaging Corporation (VREX): Price and Financial Metrics
VREX Price/Volume Stats
| Current price | $14.62 | 52-week high | $23.58 |
| Prev. close | $14.73 | 52-week low | $13.97 |
| Day low | $14.36 | Volume | 340,000 |
| Day high | $14.98 | Avg. volume | 391,153 |
| 50-day MA | $14.87 | Dividend yield | N/A |
| 200-day MA | $17.46 | Market Cap | 597.96M |
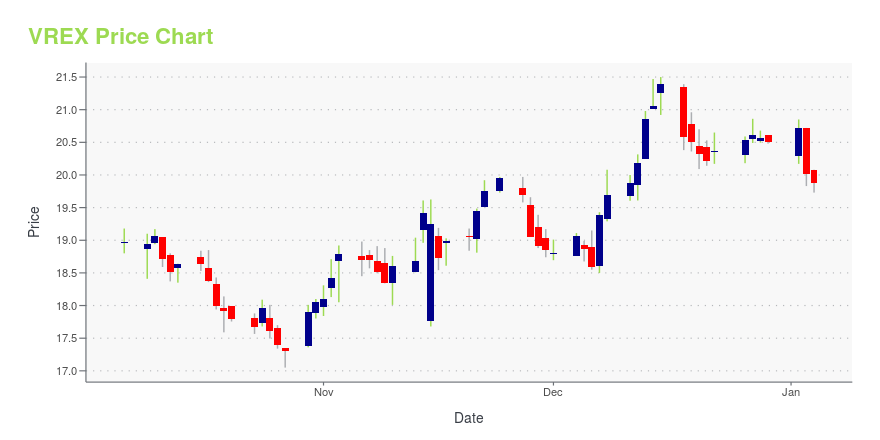
VREX Stock Price Chart Interactive Chart >
Varex Imaging Corporation (VREX) Company Bio
Varex Imaging Corporation. spun off from Varian Medical Systems, is focused on being a high-volume manufacturer of X-ray tubes, flat panel detectors and high-voltage connectors as well as a supplier of imaging software and specialized accelerators for high-energy x-ray imaging.
Latest VREX News From Around the Web
Below are the latest news stories about VAREX IMAGING CORP that investors may wish to consider to help them evaluate VREX as an investment opportunity.
Investors in Varex Imaging (NASDAQ:VREX) have unfortunately lost 22% over the last five yearsIn order to justify the effort of selecting individual stocks, it's worth striving to beat the returns from a market... |
Varex to Participate in Two Investor ConferencesSALT LAKE CITY, November 17, 2023--Varex Imaging Corporation (Nasdaq: VREX) announced today that management is scheduled to participate in two upcoming investor conferences. |
Varex Imaging Corporation (NASDAQ:VREX) Q4 2023 Earnings Call TranscriptVarex Imaging Corporation (NASDAQ:VREX) Q4 2023 Earnings Call Transcript November 14, 2023 Varex Imaging Corporation beats earnings expectations. Reported EPS is $0.45, expectations were $0.33. Operator: Greetings, and welcome to the Varex Fourth Quarter and Fiscal Year 2023 Earnings Call. At this time, all participants are in a listen-only mode. A question-and-answer session will follow […] |
Q4 2023 Varex Imaging Corp Earnings CallQ4 2023 Varex Imaging Corp Earnings Call |
Varex Imaging Corp (VREX) Reports Mixed Fiscal Year 2023 Results Amidst Industrial Segment GrowthMedical Segment Downturn Offset by Industrial Strength; Cash Flow Remains Strong |
VREX Price Returns
| 1-mo | 0.00% |
| 3-mo | -12.92% |
| 6-mo | -25.45% |
| 1-year | -36.57% |
| 3-year | -45.93% |
| 5-year | -53.82% |
| YTD | -28.68% |
| 2023 | 0.99% |
| 2022 | -35.66% |
| 2021 | 89.15% |
| 2020 | -44.05% |
| 2019 | 25.89% |
Continue Researching VREX
Want to do more research on Varex Imaging Corp's stock and its price? Try the links below:Varex Imaging Corp (VREX) Stock Price | Nasdaq
Varex Imaging Corp (VREX) Stock Quote, History and News - Yahoo Finance
Varex Imaging Corp (VREX) Stock Price and Basic Information | MarketWatch
Loading social stream, please wait...