
Ventas, Inc. (VTR): Price and Financial Metrics
VTR Price/Volume Stats
| Current price | $53.75 | 52-week high | $54.51 |
| Prev. close | $53.19 | 52-week low | $39.33 |
| Day low | $53.09 | Volume | 1,370,416 |
| Day high | $53.98 | Avg. volume | 2,264,731 |
| 50-day MA | $50.68 | Dividend yield | 3.36% |
| 200-day MA | $46.51 | Market Cap | 21.76B |
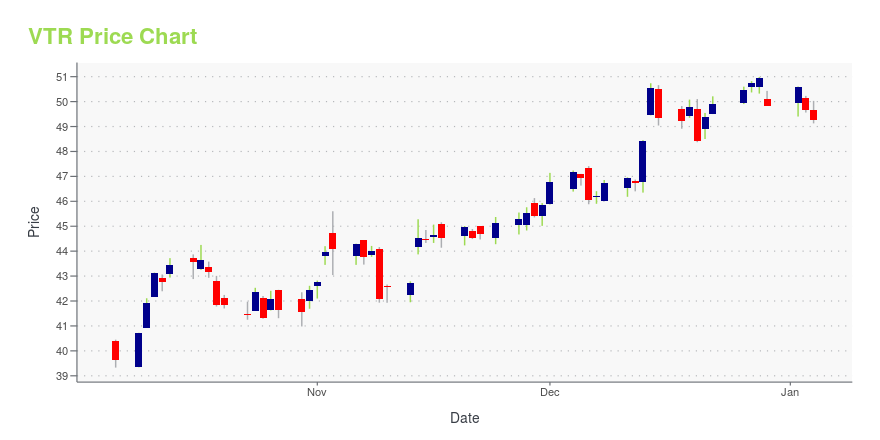
VTR Stock Price Chart Interactive Chart >
Ventas, Inc. (VTR) Company Bio
Ventas Inc. owns and operates a portfolio which consists of seniors housing communities, medical office buildings, skilled nursing facilities, hospitals and other properties. The company was founded in 1983 and is based in Chicago, Illinois.
Latest VTR News From Around the Web
Below are the latest news stories about VENTAS INC that investors may wish to consider to help them evaluate VTR as an investment opportunity.
Resilient Real Estate Stocks: 3 Picks Standing Strong Despite Market TurbulenceTraversing 2023's ebbs and flows, these real estate stocks rise as key selections for investors focused on stability and growth in 2024. |
3 Real Estate Stocks Still Worth Buying in Today’s Uncertain Housing MarketThere are still benefits to investing in real estate stocks. |
Ventas Declares Fourth Quarter 2023 Dividend of $0.45 per Common ShareCHICAGO, December 05, 2023--Ventas, Inc. (NYSE: VTR) ("Ventas" or the "Company") today announced that its Board of Directors has declared a quarterly dividend of $0.45 per common share. The dividend will be payable in cash on January 18, 2024 to stockholders of record as of the close of business on January 2, 2024. |
2 Magnificent Stocks to Buy That Are Near 52-Week LowsIf you are looking at the down-and-out REIT sector today, you'll probably want to trade up to the best companies. |
More Than 40 S&P 500 Companies Are Having Their Best Day of the YearMore than 40 S&P 500 companies were recently on track for their best day of the year, according to Dow Jones Market Data. Those companies—41 in all—ranged from Ventas, up more than 5%, to [Enphase Energy](https://www. |
VTR Price Returns
| 1-mo | 8.78% |
| 3-mo | 23.24% |
| 6-mo | 15.59% |
| 1-year | 16.41% |
| 3-year | 0.19% |
| 5-year | -0.74% |
| YTD | 9.93% |
| 2023 | 15.06% |
| 2022 | -8.53% |
| 2021 | 7.73% |
| 2020 | -9.80% |
| 2019 | 3.43% |
VTR Dividends
| Ex-Dividend Date | Type | Payout Amount | Change | ||||||
|---|---|---|---|---|---|---|---|---|---|
| Loading, please wait... | |||||||||
Continue Researching VTR
Want to do more research on Ventas Inc's stock and its price? Try the links below:Ventas Inc (VTR) Stock Price | Nasdaq
Ventas Inc (VTR) Stock Quote, History and News - Yahoo Finance
Ventas Inc (VTR) Stock Price and Basic Information | MarketWatch
Loading social stream, please wait...