Westamerica Bancorporation (WABC): Price and Financial Metrics
GET POWR RATINGS... FREE!
WABC Price/Volume Stats
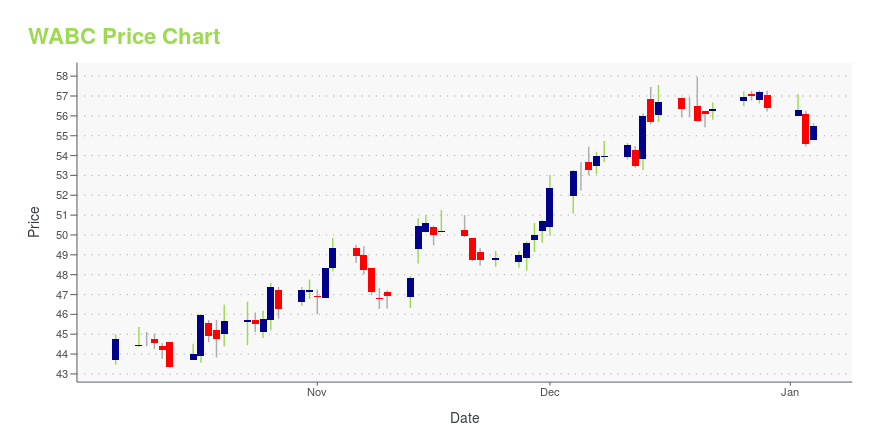
Current price | $39.33 | 52-week high | $63.86 |
Prev. close | $39.05 | 52-week low | $35.52 |
Day low | $38.71 | Volume | 112,800 |
Day high | $39.56 | Avg. volume | 215,420 |
50-day MA | $41.18 | Dividend yield | 4.3% |
200-day MA | $53.14 | Market Cap | 1.05B |
WABC Stock Price Chart Interactive Chart >
WABC POWR Grades
- Growth is the dimension where WABC ranks best; there it ranks ahead of 78.37% of US stocks.
- WABC's strongest trending metric is Value; it's been moving up over the last 179 days.
- WABC ranks lowest in Value; there it ranks in the 23rd percentile.
WABC Stock Summary
- WESTAMERICA BANCORPORATION's stock had its IPO on March 17, 1992, making it an older stock than 82.93% of US equities in our set.
- WABC's equity multiplier -- a measure of assets relative to shareholders'equity -- is greater than that of 92.89% of US stocks.
- With a year-over-year growth in debt of -33.23%, WESTAMERICA BANCORPORATION's debt growth rate surpasses just 9.84% of about US stocks.
- Stocks that are quantitatively similar to WABC, based on their financial statements, market capitalization, and price volatility, are PLBC, CCNE, MOFG, CHCO, and SPFI.
- WABC's SEC filings can be seen here. And to visit WESTAMERICA BANCORPORATION's official web site, go to www.westamerica.com.
WABC Valuation Summary
- In comparison to the median Financial Services stock, WABC's price/sales ratio is 59.09% higher, now standing at 3.5.
- WABC's EV/EBIT ratio has moved down 9.5 over the prior 243 months.
Below are key valuation metrics over time for WABC.
Stock | Date | P/S | P/B | P/E | EV/EBIT |
---|---|---|---|---|---|
WABC | 2023-05-19 | 3.5 | 1.6 | 7.3 | 4.8 |
WABC | 2023-05-18 | 3.6 | 1.6 | 7.5 | 4.9 |
WABC | 2023-05-17 | 3.6 | 1.6 | 7.5 | 4.9 |
WABC | 2023-05-16 | 3.4 | 1.5 | 7.0 | 4.6 |
WABC | 2023-05-15 | 3.5 | 1.6 | 7.2 | 4.7 |
WABC | 2023-05-12 | 3.4 | 1.6 | 7.2 | 4.7 |
WABC Growth Metrics
- The 3 year revenue growth rate now stands at 7.5%.
- The year over year price growth rate now stands at -8.93%.
- Its year over year net income to common stockholders growth rate is now at 6.44%.

The table below shows WABC's growth in key financial areas (numbers in millions of US dollars).
Date | Revenue | Operating Cash Flow | Net Income to Common Stock |
---|---|---|---|
2022-09-30 | 239.145 | 89.488 | 104.41 |
2022-06-30 | 221.612 | 85.692 | 91.713 |
2022-03-31 | 217.658 | 88.286 | 88.978 |
2021-12-31 | 214.833 | 88.735 | 86.509 |
2021-09-30 | 217.893 | 82.634 | 88.627 |
2021-06-30 | 214.668 | 87.287 | 86.615 |
WABC's Quality Factors
The “Quality” component of the POWR Ratings focuses on 31 different factors of a companies fundamentals and operational strength. Here are some key insights as we drill into the specifics of these quality attributes.- WABC has a Quality Grade of C, ranking ahead of 29.92% of graded US stocks.
- WABC's asset turnover comes in at 0.031 -- ranking 353rd of 428 Banking stocks.
- NTRS, HTBK, and FFIN are the stocks whose asset turnover ratios are most correlated with WABC.
The table below shows WABC's key quality metrics over time.
Period | Asset Turnover | Gross Margin | ROIC |
---|---|---|---|
2021-09-30 | 0.031 | 1 | 0.019 |
2021-06-30 | 0.031 | 1 | 0.019 |
2021-03-31 | 0.032 | 1 | 0.018 |
2020-12-31 | 0.032 | 1 | 0.018 |
2020-09-30 | 0.033 | 1 | 0.018 |
2020-06-30 | 0.034 | 1 | 0.019 |
WABC Price Target
For more insight on analysts targets of WABC, see our WABC price target page. And for a list of of all stocks sorted by upside potential based on analyst target price, see our Top Price Target page.
Average Price Target | $67.50 | Average Broker Recommendation | 1.75 (Moderate Buy) |
Westamerica Bancorporation (WABC) Company Bio
Westamerica Bancorp provides various banking products and services to individual and corporate customers. The company was founded in 1972 and is based in San Rafael, California.
Latest WABC News From Around the Web
Below are the latest news stories about WESTAMERICA BANCORPORATION that investors may wish to consider to help them evaluate WABC as an investment opportunity.
Westamerica Bancorporation (NASDAQ:WABC) Is Paying Out A Dividend Of $0.42The board of Westamerica Bancorporation ( NASDAQ:WABC ) has announced that it will pay a dividend on the 19th of May... |
Westamerica Bancorporation Declares Quarterly Cash DividendSAN RAFAEL, Calif., April 27, 2023 (GLOBE NEWSWIRE) -- The Board of Directors of Westamerica Bancorporation (NASDAQ: WABC) today declared a quarterly cash dividend of $0.42 per share on common stock outstanding to shareholders of record at the close of business May 8, 2023. The dividend is payable May 19, 2023. Chairman, President and CEO David Payne stated, “This quarterly dividend recognizes Westamerica’s reliable earnings stream, financial strength and conservative risk profile.” On April 20, |
Westamerica (WABC) Misses Q1 Earnings and Revenue EstimatesWestamerica (WABC) delivered earnings and revenue surprises of -2% and 1.20%, respectively, for the quarter ended March 2023. Do the numbers hold clues to what lies ahead for the stock? |
Westamerica Bancorporation Reports First Quarter 2023 Financial ResultsSAN RAFAEL, Calif., April 20, 2023 (GLOBE NEWSWIRE) -- Westamerica Bancorporation (Nasdaq: WABC), parent company of Westamerica Bank, generated net income for the first quarter 2023 of $40.5 million and diluted earnings per common share ("EPS") of $1.51. First quarter 2023 results include a provision for credit losses reversal of $1.6 million, which increased EPS $0.04. These results compare to net income for fourth quarter 2022 of $39.3 million and EPS of $1.46. "Westamerica’s first quarter 202 |
Zions (ZION) Misses Q1 Earnings EstimatesZions (ZION) delivered earnings and revenue surprises of -11.92% and 0.44%, respectively, for the quarter ended March 2023. Do the numbers hold clues to what lies ahead for the stock? |
WABC Price Returns
1-mo | -1.82% |
3-mo | -27.80% |
6-mo | -34.90% |
1-year | N/A |
3-year | -27.03% |
5-year | -20.79% |
YTD | -32.09% |
2022 | 5.18% |
2021 | 7.41% |
2020 | -16.14% |
2019 | 24.87% |
2018 | -3.92% |
WABC Dividends
Ex-Dividend Date | Type | Payout Amount | Change | ||||||
---|---|---|---|---|---|---|---|---|---|
Loading, please wait... |
Continue Researching WABC
Here are a few links from around the web to help you further your research on Westamerica Bancorporation's stock as an investment opportunity:Westamerica Bancorporation (WABC) Stock Price | Nasdaq
Westamerica Bancorporation (WABC) Stock Quote, History and News - Yahoo Finance
Westamerica Bancorporation (WABC) Stock Price and Basic Information | MarketWatch
Loading social stream, please wait...