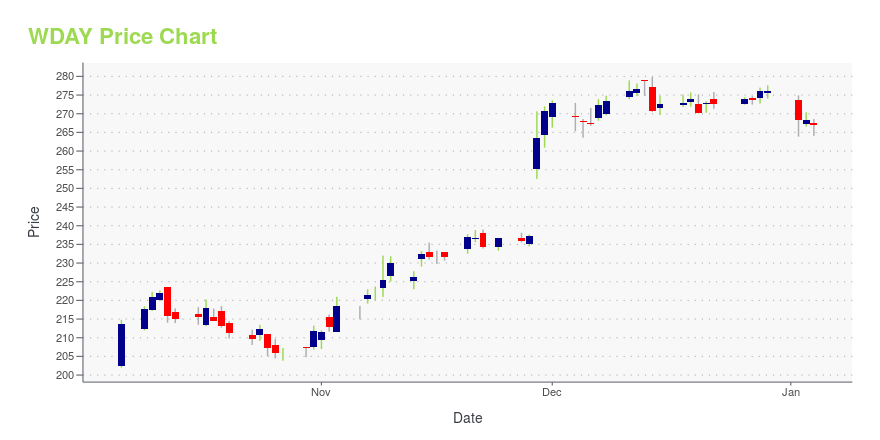
Workday Inc. Cl A (WDAY): Price and Financial Metrics
WDAY Price/Volume Stats
Current price | $213.66 | 52-week high | $252.72 |
Prev. close | $214.85 | 52-week low | $128.72 |
Day low | $212.00 | Volume | 2,168,700 |
Day high | $216.31 | Avg. volume | 1,967,427 |
50-day MA | $233.90 | Dividend yield | N/A |
200-day MA | $202.78 | Market Cap | 55.98B |
WDAY Stock Price Chart Interactive Chart >
WDAY POWR Grades
- WDAY scores best on the Growth dimension, with a Growth rank ahead of 98.81% of US stocks.
- The strongest trend for WDAY is in Growth, which has been heading up over the past 177 days.
- WDAY's current lowest rank is in the Value metric (where it is better than 32.99% of US stocks).
WDAY Stock Summary
- WDAY has a higher market value than 96.32% of US stocks; more precisely, its current market capitalization is $60,474,840,000.
- WDAY's one year PEG ratio, measuring expected growth in earnings next year relative to current common stock price is 527.46 -- higher than 94.56% of US-listed equities with positive expected earnings growth.
- With a price/sales ratio of 9, WORKDAY INC has a higher such ratio than 89.13% of stocks in our set.
- If you're looking for stocks that are quantitatively similar to WORKDAY INC, a group of peers worth examining would be MPWR, TEAM, DDOG, SNOW, and PINS.
- Visit WDAY's SEC page to see the company's official filings. To visit the company's web site, go to www.workday.com.
WDAY Valuation Summary
- In comparison to the median Technology stock, WDAY's EV/EBIT ratio is 27951.78% lower, now standing at -5486.8.
- Over the past 133 months, WDAY's price/sales ratio has gone down 30.2.
Below are key valuation metrics over time for WDAY.
Stock | Date | P/S | P/B | P/E | EV/EBIT |
---|---|---|---|---|---|
WDAY | 2023-09-22 | 9.0 | 9.6 | -497.2 | -5486.8 |
WDAY | 2023-09-21 | 9.0 | 9.6 | -495.8 | -5471.8 |
WDAY | 2023-09-20 | 9.3 | 9.9 | -512.3 | -5647.8 |
WDAY | 2023-09-19 | 9.5 | 10.2 | -523.7 | -5770.1 |
WDAY | 2023-09-18 | 9.5 | 10.2 | -526.3 | -5798.5 |
WDAY | 2023-09-15 | 9.4 | 10.1 | -518.9 | -5718.4 |
WDAY Growth Metrics
- The 5 year cash and equivalents growth rate now stands at 143.36%.
- The year over year revenue growth rate now stands at 20.64%.
- The 4 year price growth rate now stands at 74.85%.

The table below shows WDAY's growth in key financial areas (numbers in millions of US dollars).
Date | Revenue | Operating Cash Flow | Net Income to Common Stock |
---|---|---|---|
2022-09-30 | 5,945.699 | 1,577.892 | -314.305 |
2022-06-30 | 5,673.859 | 1,553.878 | -196.172 |
2022-03-31 | 5,398.422 | 1,637.993 | -26.278 |
2021-12-31 | 5,138.798 | 1,650.704 | 29.373 |
2021-09-30 | 4,894.341 | 1,589.301 | 30.919 |
2021-06-30 | 4,673.038 | 1,498.449 | -36.833 |
WDAY's Quality Factors
The “Quality” component of the POWR Ratings focuses on 31 different factors of a companies fundamentals and operational strength. Here are some key insights as we drill into the specifics of these quality attributes.- WDAY has a Quality Grade of B, ranking ahead of 77.97% of graded US stocks.
- WDAY's asset turnover comes in at 0.545 -- ranking 300th of 561 Business Services stocks.
- AUTO, NRC, and RMBL are the stocks whose asset turnover ratios are most correlated with WDAY.
The table below shows WDAY's key quality metrics over time.
Period | Asset Turnover | Gross Margin | ROIC |
---|---|---|---|
2021-07-31 | 0.545 | 0.725 | -0.012 |
2021-04-30 | 0.548 | 0.726 | -0.051 |
2021-01-31 | 0.552 | 0.723 | -0.082 |
2020-10-31 | 0.567 | 0.719 | -0.105 |
2020-07-31 | 0.577 | 0.713 | -0.140 |
2020-04-30 | 0.583 | 0.705 | -0.203 |
WDAY Price Target
For more insight on analysts targets of WDAY, see our WDAY price target page. And for a list of of all stocks sorted by upside potential based on analyst target price, see our Top Price Target page.
Average Price Target | $302.85 | Average Broker Recommendation | 1.41 (Moderate Buy) |
Workday Inc. Cl A (WDAY) Company Bio
Workday, Inc., is an American on‑demand (cloud-based) financial management, human capital management and Student information system software vendor. Workday was founded by David Duffield, founder and former CEO of ERP company PeopleSoft, along with former PeopleSoft chief strategist Aneel Bhusri, following Oracle's acquisition of PeopleSoft in 2005. (Source:Wikipedia)
Latest WDAY News From Around the Web
Below are the latest news stories about WORKDAY INC that investors may wish to consider to help them evaluate WDAY as an investment opportunity.
15 Best Cloud Computing Stocks Heading into 2024In this article, we will be taking a look at the 15 best cloud computing stocks heading into 2024. To skip our detailed analysis of the cloud computing industry, you can go directly to see the 5 Best Cloud Computing Stocks to Buy. Cloud Computing: An Area In Tech Worth Looking Into The information technology sector […] |
Why Workday Stock Sank TodayWorkday (NASDAQ: WDAY) stock sank Thursday following a downward guidance revision from management. The company's share price closed out the session down 8.5%, according to data from S&P Global Market Intelligence. At its financial analyst conference Wednesday, Workday laid out new growth targets that came in below its previous guidance range. |
Workday Plunges As New Management Lowers Revenue OutlookSoftware maker Workday lowered its outlook for subscription revenue growth through fiscal 2027. Shares plunged on the revised forecast. |
Workday Shares Tumble After Cutting Its Revenue Outlook Because of Economic UncertaintyShares of Workday sank after the human resources technology provider slashed its revenue outlook because of economic uncertainties. |
Workday, Chico's FAS: Trending TickersWorkday (WDAY) shares are down in late trading after the company slashed its annual subscription revenue guidance. Chico's FAS (CHS) shares jumped after the company announced it is being acquired by Sycamore Partners for $1 billion. Yahoo Finance Live takes a look at some of the trending tickers of the day. For more expert insight and the latest market action, click here to watch this full episode of Yahoo Finance Live. |
WDAY Price Returns
1-mo | -14.02% |
3-mo | -4.02% |
6-mo | 8.56% |
1-year | 38.52% |
3-year | -2.43% |
5-year | 52.88% |
YTD | 27.69% |
2022 | -38.75% |
2021 | 14.01% |
2020 | 45.70% |
2019 | 2.99% |
2018 | 56.95% |
Continue Researching WDAY
Want to do more research on Workday Inc's stock and its price? Try the links below:Workday Inc (WDAY) Stock Price | Nasdaq
Workday Inc (WDAY) Stock Quote, History and News - Yahoo Finance
Workday Inc (WDAY) Stock Price and Basic Information | MarketWatch
Loading social stream, please wait...