
Cactus, Inc. (WHD): Price and Financial Metrics
WHD Price/Volume Stats
| Current price | $61.00 | 52-week high | $62.27 |
| Prev. close | $59.98 | 52-week low | $37.58 |
| Day low | $59.90 | Volume | 1,194,779 |
| Day high | $62.27 | Avg. volume | 784,971 |
| 50-day MA | $52.73 | Dividend yield | 0.83% |
| 200-day MA | $47.72 | Market Cap | 4.85B |
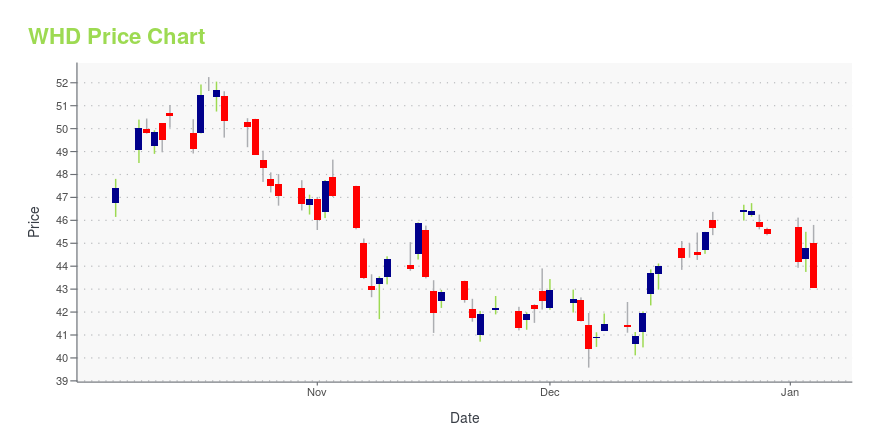
WHD Stock Price Chart Interactive Chart >
Cactus, Inc. (WHD) Company Bio
Cactus, Inc. designs, manufactures, sells, and rents a range of wellheads and pressure control equipment. Its principal products include Cactus SafeDrill wellhead systems, frac stacks, zipper manifolds, and production trees. The company also provides mission-critical field services, including 24-hour service crews to assist with the installation, maintenance, and safe handling of the wellhead and pressure control equipment, as well as repair services for equipment that it sells or rents. It sells or rents its products principally for onshore unconventional oil and gas wells that are utilized during the drilling, completion (including fracturing), and production phases of its customers’ wells. The company operates 14 service centers in the United States, as well as a service center in Eastern Australia. Cactus, Inc. was founded in 2017 and is based in Houston, Texas.
Latest WHD News From Around the Web
Below are the latest news stories about CACTUS INC that investors may wish to consider to help them evaluate WHD as an investment opportunity.
Cactus, Inc. (NYSE:WHD) Shares Could Be 22% Below Their Intrinsic Value EstimateKey Insights Using the 2 Stage Free Cash Flow to Equity, Cactus fair value estimate is US$58.46 Current share price of... |
Cactus (NYSE:WHD) jumps 3.1% this week, though earnings growth is still tracking behind three-year shareholder returnsIt hasn't been the best quarter for Cactus, Inc. ( NYSE:WHD ) shareholders, since the share price has fallen 24% in... |
Cactus, Inc. (NYSE:WHD) Is About To Go Ex-Dividend, And It Pays A 1.1% YieldCactus, Inc. ( NYSE:WHD ) stock is about to trade ex-dividend in four days. The ex-dividend date occurs one day before... |
Cactus (NYSE:WHD) Has Announced A Dividend Of $0.12Cactus, Inc.'s ( NYSE:WHD ) investors are due to receive a payment of $0.12 per share on 14th of December. Including... |
Cactus, Inc. (NYSE:WHD) Q3 2023 Earnings Call TranscriptCactus, Inc. (NYSE:WHD) Q3 2023 Earnings Call Transcript November 9, 2023 Operator: Good day, and thank you for standing by. Welcome to the Cactus, Inc. Quarter Three Earnings Call. At this time, all participants are in a listen-only mode. After the speakers’ presentation, there will be a question-and-answer session. [Operator Instructions] Please be advised that […] |
WHD Price Returns
| 1-mo | 17.35% |
| 3-mo | 18.04% |
| 6-mo | 45.69% |
| 1-year | 25.41% |
| 3-year | 70.58% |
| 5-year | 118.37% |
| YTD | 35.03% |
| 2023 | -8.69% |
| 2022 | 33.00% |
| 2021 | 47.83% |
| 2020 | -22.85% |
| 2019 | 25.57% |
WHD Dividends
| Ex-Dividend Date | Type | Payout Amount | Change | ||||||
|---|---|---|---|---|---|---|---|---|---|
| Loading, please wait... | |||||||||
Continue Researching WHD
Want to see what other sources are saying about Cactus Inc's financials and stock price? Try the links below:Cactus Inc (WHD) Stock Price | Nasdaq
Cactus Inc (WHD) Stock Quote, History and News - Yahoo Finance
Cactus Inc (WHD) Stock Price and Basic Information | MarketWatch
Loading social stream, please wait...