
Workhorse Group, Inc. (WKHS): Price and Financial Metrics
WKHS Price/Volume Stats
| Current price | $1.49 | 52-week high | $27.20 |
| Prev. close | $1.50 | 52-week low | $1.29 |
| Day low | $1.44 | Volume | 1,021,377 |
| Day high | $1.53 | Avg. volume | 818,943 |
| 50-day MA | $2.66 | Dividend yield | N/A |
| 200-day MA | $5.28 | Market Cap | 27.95M |
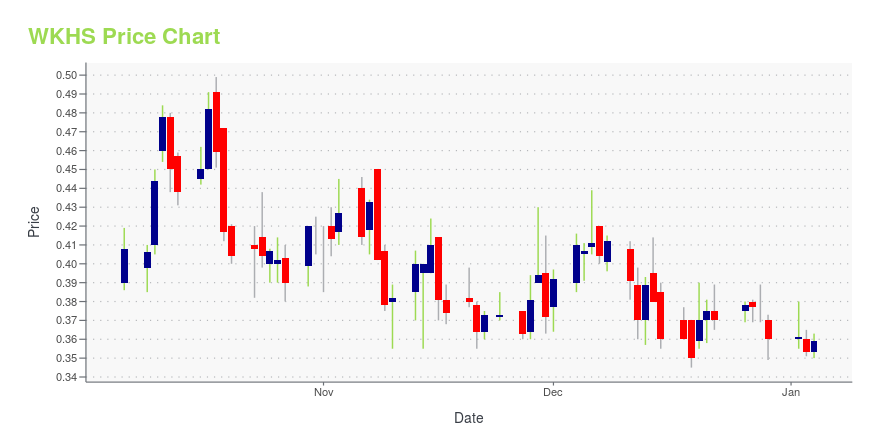
WKHS Stock Price Chart Interactive Chart >
Workhorse Group, Inc. (WKHS) Company Bio
Workhorse Group Inc. engages in the design, development, manufacture, and sale of electric medium duty trucks and unmanned aerial delivery systems that are integrated with electric vehicles. The company was founded in 2007 and is based in Loveland, Ohio.
Latest WKHS News From Around the Web
Below are the latest news stories about WORKHORSE GROUP INC that investors may wish to consider to help them evaluate WKHS as an investment opportunity.
Workhorse Highlights Achievements in 2023 Year-End Letter to ShareholdersCINCINNATI, Dec. 21, 2023 (GLOBE NEWSWIRE) -- Workhorse Group Inc. (Nasdaq: WKHS) (“Workhorse” or “the Company”), an American technology company focused on pioneering the transition to zero emission commercial vehicles, today issued a letter to its shareholders highlighting the important milestones the Company has reached throughout 2023 and opportunities ahead to enhance shareholder value and advance Workhorse’s mission. Dear Workhorse Shareholders, I would first like to take a moment to say th |
Workhorse Group Receives First Fleet Order for W56 Step VanCINCINNATI, Dec. 20, 2023 (GLOBE NEWSWIRE) -- Workhorse Group Inc. (Nasdaq: WKHS) (“Workhorse” or “the Company”), an American technology company focused on pioneering the transition to zero emission commercial vehicles, today announced it has received its first fleet order for the W56 step van from Mission Linen Supply, a California based, privately-held company that is a leading provider of products and services to hospitality, medical and industrial businesses. The initial 15-vehicle order is |
Workhorse Group Expands West Coast Presence, Adding The Truck Shop as its Latest DealerCINCINNATI, Dec. 19, 2023 (GLOBE NEWSWIRE) -- Workhorse Group Inc. (Nasdaq: WKHS) (“Workhorse” or “the Company”), an American technology company focused on pioneering the transition to zero emission commercial vehicles, today announced it has added The Truck Shop as a dealer, bringing the Company’s total dealer count to nine. With locations in Washington and Oregon, The Truck Shop expands Workhorse’s dealer network on the West Coast and serves as a gateway to sales in the Pacific Northwest. The |
WKHS Stock: Workhorse Flirts With Dilution in $50 Million Share SaleWKHS stock is sinking lower after the company announced a $50 million share offering and a bond and warrant offering. |
Workhorse Group Expands Dealer Network to Eight Partners NationwideCINCINNATI, Nov. 29, 2023 (GLOBE NEWSWIRE) -- Workhorse Group Inc. (Nasdaq: WKHS) (“Workhorse” or “the Company”), an American technology company focused on pioneering the transition to zero emission commercial vehicles, today announced it has added Colonial Equipment Company and Freeway Isuzu to its growing network of dealers across the United States. The Company also announced that Fairway EV has recently been confirmed as a Workhorse Certified Dealer. The Certified Dealer Program is an initiat |
WKHS Price Returns
| 1-mo | -12.87% |
| 3-mo | -52.55% |
| 6-mo | -73.68% |
| 1-year | -93.10% |
| 3-year | -99.32% |
| 5-year | -98.14% |
| YTD | -79.31% |
| 2023 | -76.32% |
| 2022 | -65.14% |
| 2021 | -77.96% |
| 2020 | 550.66% |
| 2019 | 475.76% |
Continue Researching WKHS
Want to see what other sources are saying about Workhorse Group Inc's financials and stock price? Try the links below:Workhorse Group Inc (WKHS) Stock Price | Nasdaq
Workhorse Group Inc (WKHS) Stock Quote, History and News - Yahoo Finance
Workhorse Group Inc (WKHS) Stock Price and Basic Information | MarketWatch
Loading social stream, please wait...