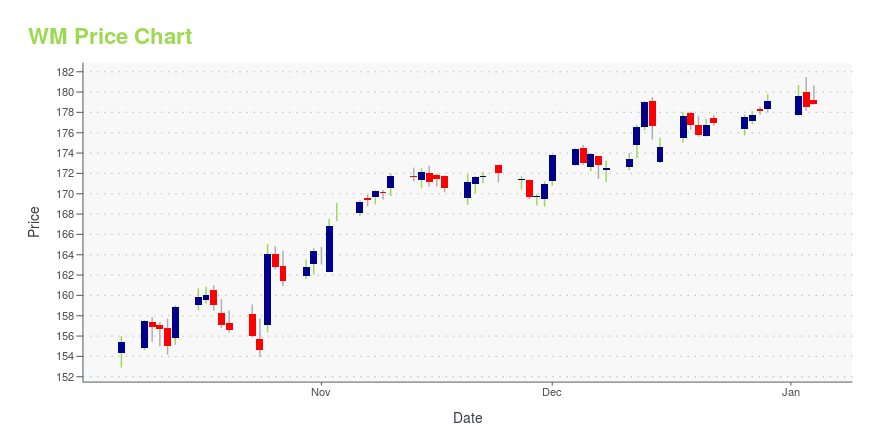
Waste Management Inc. (WM): Price and Financial Metrics
GET POWR RATINGS... FREE!
WM Price/Volume Stats
Current price | $161.46 | 52-week high | $175.98 |
Prev. close | $161.28 | 52-week low | $138.89 |
Day low | $160.22 | Volume | 449,296 |
Day high | $161.88 | Avg. volume | 1,717,022 |
50-day MA | $163.52 | Dividend yield | 1.74% |
200-day MA | $161.09 | Market Cap | 65.68B |
WM Stock Price Chart Interactive Chart >
WM POWR Grades
- WM scores best on the Stability dimension, with a Stability rank ahead of 92.62% of US stocks.
- The strongest trend for WM is in Growth, which has been heading down over the past 179 days.
- WM ranks lowest in Value; there it ranks in the 39th percentile.
WM Stock Summary
- With a market capitalization of $66,156,532,567, WASTE MANAGEMENT INC has a greater market value than 96.82% of US stocks.
- WM's went public 31.67 years ago, making it older than 85.03% of listed US stocks we're tracking.
- The volatility of WASTE MANAGEMENT INC's share price is greater than that of merely 1.34% US stocks with at least 200 days of trading history.
- Stocks with similar financial metrics, market capitalization, and price volatility to WASTE MANAGEMENT INC are ENB, FDX, RSG, MPC, and CP.
- WM's SEC filings can be seen here. And to visit WASTE MANAGEMENT INC's official web site, go to www.wm.com.
WM Valuation Summary
- WM's EV/EBIT ratio is 24.5; this is 56.05% higher than that of the median Industrials stock.
- Over the past 243 months, WM's price/earnings ratio has gone up 10.4.
Below are key valuation metrics over time for WM.
Stock | Date | P/S | P/B | P/E | EV/EBIT |
---|---|---|---|---|---|
WM | 2023-05-19 | 3.4 | 9.9 | 29.8 | 24.5 |
WM | 2023-05-18 | 3.4 | 9.9 | 29.7 | 24.5 |
WM | 2023-05-17 | 3.4 | 10.0 | 30.0 | 24.7 |
WM | 2023-05-16 | 3.4 | 10.0 | 30.2 | 24.8 |
WM | 2023-05-15 | 3.4 | 10.1 | 30.4 | 24.9 |
WM | 2023-05-12 | 3.5 | 10.1 | 30.5 | 25.0 |
WM Growth Metrics
- The 5 year net cashflow from operations growth rate now stands at 26.02%.
- Its year over year net cashflow from operations growth rate is now at 19.11%.
- Its 3 year price growth rate is now at 55.56%.

The table below shows WM's growth in key financial areas (numbers in millions of US dollars).
Date | Revenue | Operating Cash Flow | Net Income to Common Stock |
---|---|---|---|
2022-12-31 | 19,698 | 4,536 | 2,238 |
2022-09-30 | 19,441 | 4,478 | 2,245 |
2022-06-30 | 19,031 | 4,480 | 2,144 |
2022-03-31 | 18,480 | 4,476 | 1,908 |
2021-12-31 | 17,931 | 4,338 | 1,816 |
2021-09-30 | 17,320 | 4,100 | 1,748 |
WM's Quality Factors
The “Quality” component of the POWR Ratings focuses on 31 different factors of a companies fundamentals and operational strength. Here are some key insights as we drill into the specifics of these quality attributes.- WM has a Quality Grade of B, ranking ahead of 91.08% of graded US stocks.
- WM's asset turnover comes in at 0.596 -- ranking 8th of 14 Almost Nothing stocks.
- HCCI, CWST, and PESI are the stocks whose asset turnover ratios are most correlated with WM.
The table below shows WM's key quality metrics over time.
Period | Asset Turnover | Gross Margin | ROIC |
---|---|---|---|
2021-09-30 | 0.596 | 0.385 | 0.094 |
2021-06-30 | 0.589 | 0.390 | 0.090 |
2021-03-31 | 0.568 | 0.389 | 0.092 |
2020-12-31 | 0.564 | 0.386 | 0.089 |
2020-09-30 | 0.564 | 0.390 | 0.091 |
2020-06-30 | 0.556 | 0.387 | 0.092 |
WM Price Target
For more insight on analysts targets of WM, see our WM price target page. And for a list of of all stocks sorted by upside potential based on analyst target price, see our Top Price Target page.
Average Price Target | $159.33 | Average Broker Recommendation | 1.69 (Moderate Buy) |
Waste Management Inc. (WM) Company Bio
Waste Management, Inc. is an U.S.-headquartered waste management, comprehensive waste, and environmental services company operating in North America. Founded in 1968, the company is headquartered in the First City Tower in Houston, Texas. (Source:Wikipedia)
Latest WM News From Around the Web
Below are the latest news stories about WASTE MANAGEMENT INC that investors may wish to consider to help them evaluate WM as an investment opportunity.
Bath & Body Works entices loyal customersWall Street traded mixed on a cocktail of economic data and earnings reports, as investors keep an eye on the progress of ongoing debt ceiling negotiations.The latest U.S. data releases reflected economic uncertainty across the nation as higher inflation and interest rates affected the consumer.April existing home sales declined 3.4% from March, to a seasonally adjusted annual rate of 4.28 million – but the reading was not as dire as expected. The National Association of Realtors report showed that sales tumbled 23.2% compared to a year earlier, while the national median price of existing homes posted its biggest annual decline in over a decade.Other data releases included the Conference Board’s Leading Economic Index that showed a decline for the 13th consecutive month in April, while ... |
Here's Why We Think Waste Management (NYSE:WM) Is Well Worth WatchingFor beginners, it can seem like a good idea (and an exciting prospect) to buy a company that tells a good story to... |
Why Waste Management (WM) is a Top Growth Stock for the Long-TermWhether you're a value, growth, or momentum investor, finding strong stocks becomes easier with the Zacks Style Scores, a top feature of the Zacks Premium research service. |
Boasting A 33% Return On Equity, Is Waste Management, Inc. (NYSE:WM) A Top Quality Stock?While some investors are already well versed in financial metrics (hat tip), this article is for those who would like... |
2 Top Dividend Stocks You Can Buy and Hold ForeverLong-term investors tend to flock to dividend stocks for their ability to provide a steady source of income, and the often-proven track records of their businesses. To see how a growing dividend can transform a portfolio, look no further than Berkshire Hathaway's investment in Coca-Cola. In 1994, Berkshire completed its seven-year purchase of Coca-Cola at a total cost of $1.3 billion. |
WM Price Returns
1-mo | -2.76% |
3-mo | 9.00% |
6-mo | -3.34% |
1-year | N/A |
3-year | 59.19% |
5-year | 113.56% |
YTD | 3.40% |
2022 | -4.49% |
2021 | 43.82% |
2020 | 5.46% |
2019 | 30.45% |
2018 | 5.32% |
WM Dividends
Ex-Dividend Date | Type | Payout Amount | Change | ||||||
---|---|---|---|---|---|---|---|---|---|
Loading, please wait... |
Continue Researching WM
Here are a few links from around the web to help you further your research on Waste Management Inc's stock as an investment opportunity:Waste Management Inc (WM) Stock Price | Nasdaq
Waste Management Inc (WM) Stock Quote, History and News - Yahoo Finance
Waste Management Inc (WM) Stock Price and Basic Information | MarketWatch
Loading social stream, please wait...