Watsco, Inc. (WSO): Price and Financial Metrics
WSO Price/Volume Stats
Current price | $431.97 | 52-week high | $441.29 |
Prev. close | $434.28 | 52-week low | $298.79 |
Day low | $431.15 | Volume | 224,700 |
Day high | $435.97 | Avg. volume | 353,943 |
50-day MA | $400.51 | Dividend yield | 2.28% |
200-day MA | $382.37 | Market Cap | 17.06B |
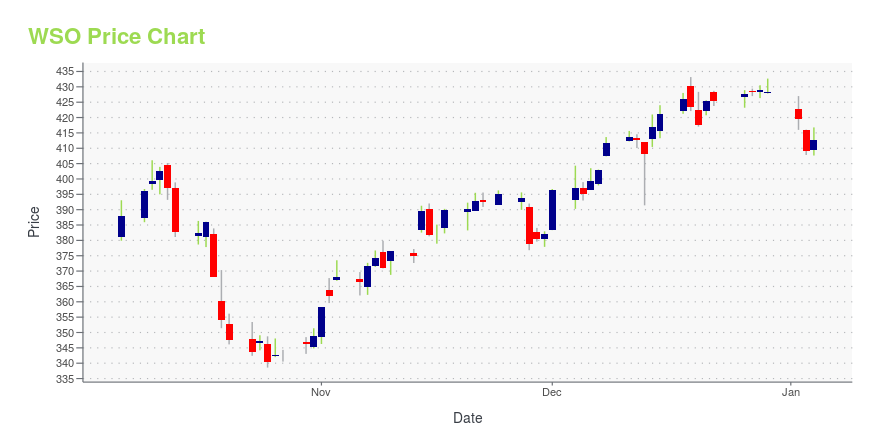
WSO Stock Price Chart Interactive Chart >
WSO POWR Grades
- WSO scores best on the Momentum dimension, with a Momentum rank ahead of 97.55% of US stocks.
- The strongest trend for WSO is in Growth, which has been heading up over the past 26 weeks.
- WSO's current lowest rank is in the Sentiment metric (where it is better than 4.54% of US stocks).
WSO Stock Summary
- WSO's one year PEG ratio, measuring expected growth in earnings next year relative to current common stock price is 4,323.15 -- higher than 99.21% of US-listed equities with positive expected earnings growth.
- WSO's went public 38.03 years ago, making it older than 92.92% of listed US stocks we're tracking.
- Of note is the ratio of WATSCO INC's sales and general administrative expense to its total operating expenses; 98.19% of US stocks have a lower such ratio.
- If you're looking for stocks that are quantitatively similar to WATSCO INC, a group of peers worth examining would be AZEK, ROP, NDSN, FND, and FUL.
- Visit WSO's SEC page to see the company's official filings. To visit the company's web site, go to www.watsco.com.
WSO Valuation Summary
- In comparison to the median Industrials stock, WSO's price/sales ratio is 9.52% higher, now standing at 2.3.
- WSO's price/sales ratio has moved up 1.8 over the prior 243 months.
Below are key valuation metrics over time for WSO.
Stock | Date | P/S | P/B | P/E | EV/EBIT |
---|---|---|---|---|---|
WSO | 2023-12-29 | 2.3 | 7.6 | 28.5 | 23.8 |
WSO | 2023-12-28 | 2.3 | 7.6 | 28.6 | 23.8 |
WSO | 2023-12-27 | 2.3 | 7.6 | 28.5 | 23.8 |
WSO | 2023-12-26 | 2.3 | 7.6 | 28.5 | 23.8 |
WSO | 2023-12-22 | 2.3 | 7.5 | 28.3 | 23.6 |
WSO | 2023-12-21 | 2.3 | 7.5 | 28.3 | 23.6 |
WSO Growth Metrics
- Its 3 year revenue growth rate is now at 46.5%.
- The year over year net income to common stockholders growth rate now stands at 62.2%.
- The year over year price growth rate now stands at -11.58%.
The table below shows WSO's growth in key financial areas (numbers in millions of US dollars).
Date | Revenue | Operating Cash Flow | Net Income to Common Stock |
---|---|---|---|
2022-12-31 | 7,274.344 | 571.964 | 601.167 |
2022-09-30 | 7,204.986 | 388.774 | 542.382 |
2022-06-30 | 6,951.759 | 340.756 | 525.606 |
2022-03-31 | 6,667.644 | 285.689 | 477.151 |
2021-12-31 | 6,280.192 | 349.566 | 418.945 |
2021-09-30 | 5,923.043 | 481.273 | 386.069 |
WSO's Quality Factors
The “Quality” component of the POWR Ratings focuses on 31 different factors of a companies fundamentals and operational strength. Here are some key insights as we drill into the specifics of these quality attributes.- WSO has a Quality Grade of B, ranking ahead of 89.12% of graded US stocks.
- WSO's asset turnover comes in at 2.073 -- ranking 33rd of 105 Wholesale stocks.
- ASPN, HSIC, and ASH are the stocks whose asset turnover ratios are most correlated with WSO.
The table below shows WSO's key quality metrics over time.
Period | Asset Turnover | Gross Margin | ROIC |
---|---|---|---|
2021-06-30 | 2.073 | 0.252 | 0.272 |
2021-03-31 | 1.982 | 0.245 | 0.239 |
2020-12-31 | 1.953 | 0.242 | 0.213 |
2020-09-30 | 1.908 | 0.242 | 0.195 |
2020-06-30 | 1.846 | 0.241 | 0.171 |
2020-03-31 | 1.853 | 0.242 | 0.168 |
WSO Price Target
For more insight on analysts targets of WSO, see our WSO price target page. And for a list of of all stocks sorted by upside potential based on analyst target price, see our Top Price Target page.
Average Price Target | $303.86 | Average Broker Recommendation | 1.89 (Hold) |
Watsco, Inc. (WSO) Company Bio
Watsco distributes air conditioning, heating, and refrigeration equipment; and related parts and supplies in the United States, Canada, Mexico, and Puerto Rico. The company was founded in 1945 and is based in Miami, Florida.
Latest WSO News From Around the Web
Below are the latest news stories about WATSCO INC that investors may wish to consider to help them evaluate WSO as an investment opportunity.
Why Investors Need to Take Advantage of These 2 Construction Stocks NowThe Zacks Earnings ESP is a great way to find potential earnings surprises. Why investors should take advantage now. |
These Two Players In Home Construction Are Reaching New HighsThis homebuilder stock hit a 52-week high on Friday and topped a buy zone. An air conditioning and heating stock also hit a buy point on Friday. |
7 High-Dividend Stocks to Buy for a Lifetime of Passive IncomeThese high-dividend stocks are among the biggest beneficiaries of current mega trends, and investors can leverage them for big gains. |
Watsco, Inc.'s (NYSE:WSO) Stock's On An Uptrend: Are Strong Financials Guiding The Market?Watsco (NYSE:WSO) has had a great run on the share market with its stock up by a significant 11% over the last three... |
AZEK to Report Solid Q4 Earnings on Strong Residential UnitAZEK's operational excellence, sourcing savings and recycling initiatives and lower raw material costs are likely to aid its fiscal fourth-quarter performance. |
WSO Price Returns
1-mo | 9.09% |
3-mo | 1.43% |
6-mo | 15.80% |
1-year | 40.76% |
3-year | 81.31% |
5-year | 255.34% |
YTD | 1.43% |
2023 | 77.00% |
2022 | -17.74% |
2021 | 42.09% |
2020 | 30.57% |
2019 | 34.99% |
WSO Dividends
Ex-Dividend Date | Type | Payout Amount | Change | ||||||
---|---|---|---|---|---|---|---|---|---|
Loading, please wait... |
Continue Researching WSO
Want to see what other sources are saying about Watsco Inc's financials and stock price? Try the links below:Watsco Inc (WSO) Stock Price | Nasdaq
Watsco Inc (WSO) Stock Quote, History and News - Yahoo Finance
Watsco Inc (WSO) Stock Price and Basic Information | MarketWatch
Loading social stream, please wait...