
White Mountains Insurance Group, Ltd. (WTM): Price and Financial Metrics
WTM Price/Volume Stats
| Current price | $1,750.18 | 52-week high | $1,899.21 |
| Prev. close | $1,703.00 | 52-week low | $1,401.01 |
| Day low | $1,708.00 | Volume | 10,672 |
| Day high | $1,772.14 | Avg. volume | 10,945 |
| 50-day MA | $1,753.08 | Dividend yield | 0.06% |
| 200-day MA | $1,655.92 | Market Cap | 4.49B |
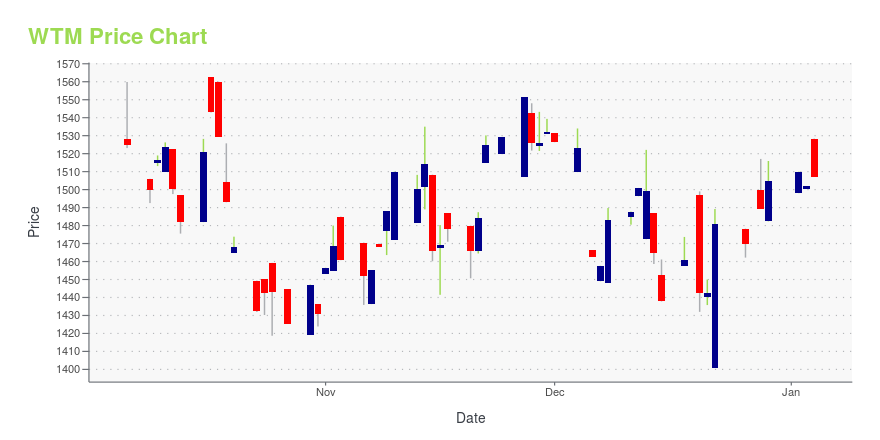
WTM Stock Price Chart Interactive Chart >
White Mountains Insurance Group, Ltd. (WTM) Company Bio
White Mountains Insurance Group engages in the property and casualty insurance and reinsurance businesses. It operates in four segments: OneBeacon, Sirius Group, HG Global/BAM, and Other Operations. The company was founded in 1980 and is based in Hamilton, Bermuda.
Latest WTM News From Around the Web
Below are the latest news stories about WHITE MOUNTAINS INSURANCE GROUP LTD that investors may wish to consider to help them evaluate WTM as an investment opportunity.
Bearish Bets: 3 Stocks You Absolutely Should Think About Shorting This WeekUsing technical analysis of the charts of those stocks, and, when appropriate, recent actions and grades from TheStreet's Quant Ratings, we zero in on three names. Ollie's Bargain Outlet Holdings Inc. recently was downgraded to Hold with a C+ rating by TheStreet's Quant Ratings. The discount retailer was looking quite good until the stock took a big tumble in November. |
White Mountains Renews Lead Commitment in Ark-Sponsored Reinsurance SidecarWhite Mountains Insurance Group, Ltd. (NYSE: WTM) ("White Mountains") announced today that Ark Insurance Holdings Limited ("Ark"), its specialty property and casualty reinsurance and insurance subsidiary, has renewed Outrigger Re Ltd. ("Outrigger") for business incepted during calendar year 2024. The renewal is on similar terms as were in effect for calendar year 2023. |
Sage Advisory Services Adds Kudu Investment Management as Minority PartnerSage Advisory Services, Ltd. (Sage), an investment manager with more than $23 billion in client assets under management and advisement, primarily in fixed income strategies, and Kudu Investment Management, LLC (Kudu), a provider of permanent capital solutions to independent asset and wealth managers, today announced that Kudu has made a minority investment in Sage. Financial terms were not disclosed. |
Insider Buying: Director Weston Hicks Acquires Shares of White Mountains Insurance Group LtdInsider buying is often regarded as a strong signal about the prospects of a company. When insiders purchase shares, they demonstrate confidence in the company's future performance. |
White Mountains Insurance Group Ltd (WTM) Reports Q3 2023 EarningsBook Value Per Share Increases 1% in Q3 and 6% YTD |
WTM Price Returns
| 1-mo | 0.85% |
| 3-mo | -1.03% |
| 6-mo | 9.67% |
| 1-year | 11.11% |
| 3-year | 55.62% |
| 5-year | 64.68% |
| YTD | 16.36% |
| 2023 | 6.49% |
| 2022 | 39.63% |
| 2021 | 1.41% |
| 2020 | -10.19% |
| 2019 | 30.20% |
WTM Dividends
| Ex-Dividend Date | Type | Payout Amount | Change | ||||||
|---|---|---|---|---|---|---|---|---|---|
| Loading, please wait... | |||||||||
Continue Researching WTM
Want to do more research on White Mountains Insurance Group Ltd's stock and its price? Try the links below:White Mountains Insurance Group Ltd (WTM) Stock Price | Nasdaq
White Mountains Insurance Group Ltd (WTM) Stock Quote, History and News - Yahoo Finance
White Mountains Insurance Group Ltd (WTM) Stock Price and Basic Information | MarketWatch
Loading social stream, please wait...