Workday Inc. Cl A (WDAY): Price and Financial Metrics

Workday Inc. Cl A (WDAY): $230.17

7.63 (-3.21%)

POWR Rating

Component Grades

Momentum

C

Stability

C

Sentiment

Quality

B

Add WDAY to Watchlist
Sign Up

Industry: Software - Application

Industry

C

Ranked

#22 of 133

in industry

WDAY Price/Volume Stats

Current price $230.17 52-week high $252.72
Prev. close $237.80 52-week low $128.72
Day low $229.71 Volume 1,746,800
Day high $235.86 Avg. volume 1,927,250
50-day MA $234.24 Dividend yield N/A
200-day MA $200.87 Market Cap 60.30B

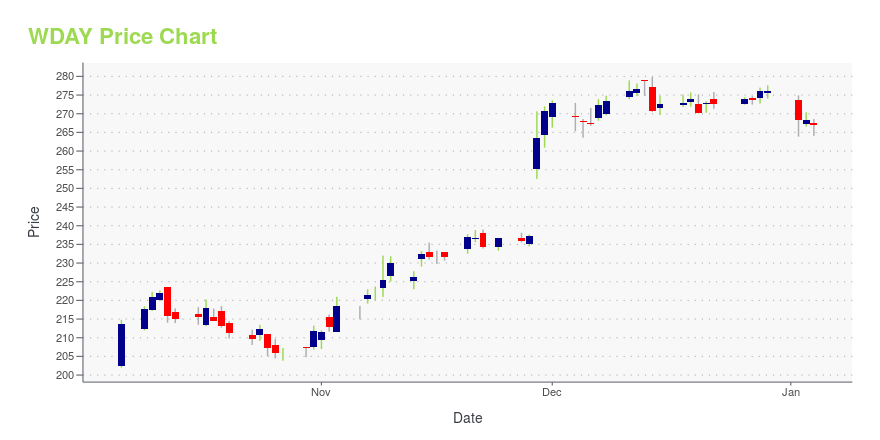
WDAY Stock Price Chart Interactive Chart >

WDAY POWR Grades

  • WDAY scores best on the Growth dimension, with a Growth rank ahead of 98.79% of US stocks.
  • WDAY's strongest trending metric is Growth; it's been moving up over the last 179 days.
  • WDAY's current lowest rank is in the Value metric (where it is better than 32.19% of US stocks).

WDAY Stock Summary

  • With a market capitalization of $64,014,460,000, WORKDAY INC has a greater market value than 96.45% of US stocks.
  • With a one year PEG ratio of 558.33, WORKDAY INC is expected to have a higher PEG ratio (a measure of how expensive a stock is relative to its expected earnings growth) than 94.87% of US stocks.
  • With a price/sales ratio of 9.53, WORKDAY INC has a higher such ratio than 89.36% of stocks in our set.
  • Stocks with similar financial metrics, market capitalization, and price volatility to WORKDAY INC are MPWR, TEAM, DDOG, SNOW, and MANH.
  • WDAY's SEC filings can be seen here. And to visit WORKDAY INC's official web site, go to www.workday.com.

WDAY Valuation Summary

  • WDAY's EV/EBIT ratio is -5718.4; this is 28131.37% lower than that of the median Technology stock.
  • WDAY's price/sales ratio has moved down 29.8 over the prior 133 months.

Below are key valuation metrics over time for WDAY.

Stock Date P/S P/B P/E EV/EBIT
WDAY 2023-09-15 9.4 10.1 -518.9 -5718.4
WDAY 2023-09-14 9.6 10.2 -528.0 -5815.8
WDAY 2023-09-13 9.6 10.2 -528.2 -5818.3
WDAY 2023-09-12 9.7 10.3 -533.7 -5876.9
WDAY 2023-09-11 9.8 10.5 -543.3 -5980.3
WDAY 2023-09-08 9.8 10.5 -539.9 -5943.8

WDAY Growth Metrics

    The 5 year cash and equivalents growth rate now stands at 143.36%.
  • The year over year revenue growth rate now stands at 20.64%.
  • The 4 year price growth rate now stands at 74.85%.
WDAY's revenue has moved up $1,272,661,000 over the prior 15 months.

The table below shows WDAY's growth in key financial areas (numbers in millions of US dollars).

Date Revenue Operating Cash Flow Net Income to Common Stock
2022-09-30 5,945.699 1,577.892 -314.305
2022-06-30 5,673.859 1,553.878 -196.172
2022-03-31 5,398.422 1,637.993 -26.278
2021-12-31 5,138.798 1,650.704 29.373
2021-09-30 4,894.341 1,589.301 30.919
2021-06-30 4,673.038 1,498.449 -36.833

WDAY's Quality Factors

The “Quality” component of the POWR Ratings focuses on 31 different factors of a companies fundamentals and operational strength. Here are some key insights as we drill into the specifics of these quality attributes.
  • WDAY has a Quality Grade of B, ranking ahead of 77.97% of graded US stocks.
  • WDAY's asset turnover comes in at 0.545 -- ranking 300th of 561 Business Services stocks.
  • AUTO, NRC, and RMBL are the stocks whose asset turnover ratios are most correlated with WDAY.

The table below shows WDAY's key quality metrics over time.

Period Asset Turnover Gross Margin ROIC
2021-07-31 0.545 0.725 -0.012
2021-04-30 0.548 0.726 -0.051
2021-01-31 0.552 0.723 -0.082
2020-10-31 0.567 0.719 -0.105
2020-07-31 0.577 0.713 -0.140
2020-04-30 0.583 0.705 -0.203

WDAY Price Target

For more insight on analysts targets of WDAY, see our WDAY price target page. And for a list of of all stocks sorted by upside potential based on analyst target price, see our Top Price Target page.

Average Price Target $302.85 Average Broker Recommendation 1.41 (Moderate Buy)

Workday Inc. Cl A (WDAY) Company Bio


Workday, Inc., is an American on‑demand (cloud-based) financial managementhuman capital management and Student information system software vendor. Workday was founded by David Duffield, founder and former CEO of ERP company PeopleSoft, along with former PeopleSoft chief strategist Aneel Bhusri, following Oracle's acquisition of PeopleSoft in 2005. (Source:Wikipedia)


WDAY Latest News Stream


Event/Time News Detail
Loading, please wait...

WDAY Latest Social Stream


Loading social stream, please wait...

View Full WDAY Social Stream

Latest WDAY News From Around the Web

Below are the latest news stories about WORKDAY INC that investors may wish to consider to help them evaluate WDAY as an investment opportunity.

UiPath Stock Hits 80-Plus Relative Strength Rating Benchmark

UiPath shows improving price performance, earning an upgrade to its IBD Relative Strength Rating from 79 to 82.

Yahoo | September 18, 2023

Are You a Momentum Investor? This 1 Stock Could Be the Perfect Pick

Whether you're a value, growth, or momentum investor, finding strong stocks becomes easier with the Zacks Style Scores, a top feature of the Zacks Premium research service.

Yahoo | September 18, 2023

If You Invested $1000 in Workday a Decade Ago, This is How Much It'd Be Worth Now

Investing in certain stocks can pay off in the long run, especially if you hold on for a decade or more.

Yahoo | September 18, 2023

BBBYQ Stock Alert: Bed Bath & Beyond Still Owes $1.5 BILLION to Creditors

BBBYQ stock is falling lower after the company released its monthly operating reports for June and July.

Eddie Pan on InvestorPlace | September 14, 2023

10% Owner David Duffield Sells 108,333 Shares of Workday Inc (WDAY)

On September 11, 2023, David Duffield, a 10% owner of Workday Inc (NASDAQ:WDAY), sold 108,333 shares of the company.

Yahoo | September 14, 2023

Read More 'WDAY' Stories Here

WDAY Price Returns

1-mo -0.02%
3-mo 3.56%
6-mo 20.87%
1-year 52.95%
3-year 8.67%
5-year 66.03%
YTD 37.55%
2022 -38.75%
2021 14.01%
2020 45.70%
2019 2.99%
2018 56.95%

Get Free Updates

Join thousands of investors who get the latest news, insights and top rated picks from StockNews.com!