
Xcel Energy Inc. (XEL): Price and Financial Metrics
XEL Price/Volume Stats
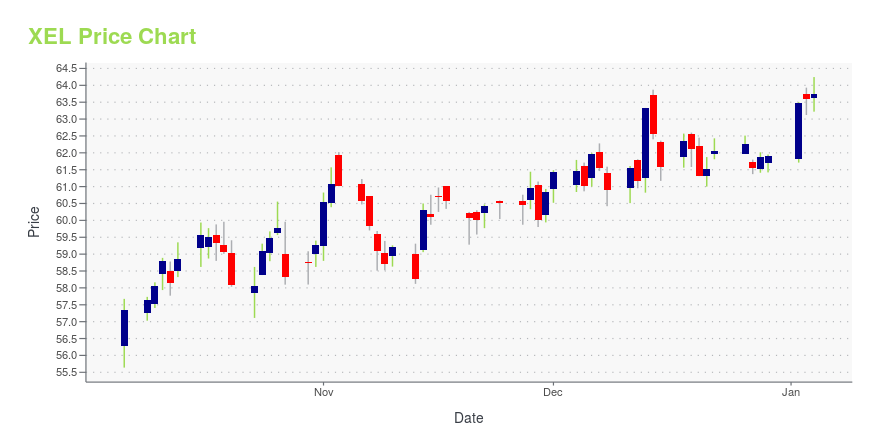
| Current price | $57.36 | 52-week high | $64.77 |
| Prev. close | $56.87 | 52-week low | $46.79 |
| Day low | $57.10 | Volume | 3,434,870 |
| Day high | $57.67 | Avg. volume | 4,508,711 |
| 50-day MA | $54.47 | Dividend yield | 3.97% |
| 200-day MA | $56.92 | Market Cap | 31.87B |
XEL Stock Price Chart Interactive Chart >
Xcel Energy Inc. (XEL) Company Bio
Xcel Energy Inc. is an American utility holding company based in Minneapolis, Minnesota, serving more than 3.7 million electric customers and 2.1 million natural gas customers in Minnesota, Michigan, Wisconsin, North Dakota, South Dakota, Colorado, Texas, and New Mexico in 2019. It consists of four operating subsidiaries: Northern States Power-Minnesota, Northern States Power-Wisconsin, Public Service Company of Colorado, and Southwestern Public Service Co. (Source:Wikipedia)
Latest XEL News From Around the Web
Below are the latest news stories about XCEL ENERGY INC that investors may wish to consider to help them evaluate XEL as an investment opportunity.
Xcel Energy Inc's Dividend AnalysisXcel Energy Inc (NASDAQ:XEL) recently announced a dividend of $0.52 per share, payable on 2024-01-20, with the ex-dividend date set for 2023-12-27. As investors look forward to this upcoming payment, the spotlight also shines on the company's dividend history, yield, and growth rates. Using the data from GuruFocus, let's look into Xcel Energy Inc's dividend performance and assess its sustainability. |
Colorado PUC delays 2.1 GW of Xcel wind and solar, citing cost concernsWhile regulators approved the addition of 50% less wind capacity and 18% less solar capacity than Xcel proposed, they approved 58% more energy storage power capacity than the utility’s preferred portfolio. |
13 Most Profitable Utility Stocks NowIn this piece, we will take a look at the 13 most profitable utility stocks to buy now. If you want to skip our analysis of the utility industry and the recent developments, then you can take a look at the 5 Most Profitable Utility Stocks Now. The utility industry stands to be disrupted the […] |
3 of the Most Attractive Dividend Stocks in the Utilities SpaceAt a cursory glance, the concept of dividend stocks – particularly in the boring utilities space – seems overly cautious. |
Xcel Energy fined $14,000 after leaks of radioactive tritium from its Monticello plant in MinnesotaXcel Energy has been fined $14,000 related to leaks of radioactive tritium from its nuclear power plant at Monticello, Minnesota regulators announced Thursday. The relatively small fine was not for the leaks themselves, but because Xcel started pumping contaminated groundwater into a temporary storage tank before it had the necessary permit in place, which it later obtained. |
XEL Price Returns
| 1-mo | 6.64% |
| 3-mo | 7.38% |
| 6-mo | -1.38% |
| 1-year | -5.21% |
| 3-year | -9.13% |
| 5-year | 9.97% |
| YTD | -5.40% |
| 2023 | -8.67% |
| 2022 | 6.45% |
| 2021 | 4.40% |
| 2020 | 7.77% |
| 2019 | 32.37% |
XEL Dividends
| Ex-Dividend Date | Type | Payout Amount | Change | ||||||
|---|---|---|---|---|---|---|---|---|---|
| Loading, please wait... | |||||||||
Continue Researching XEL
Want to do more research on Xcel Energy Inc's stock and its price? Try the links below:Xcel Energy Inc (XEL) Stock Price | Nasdaq
Xcel Energy Inc (XEL) Stock Quote, History and News - Yahoo Finance
Xcel Energy Inc (XEL) Stock Price and Basic Information | MarketWatch
Loading social stream, please wait...