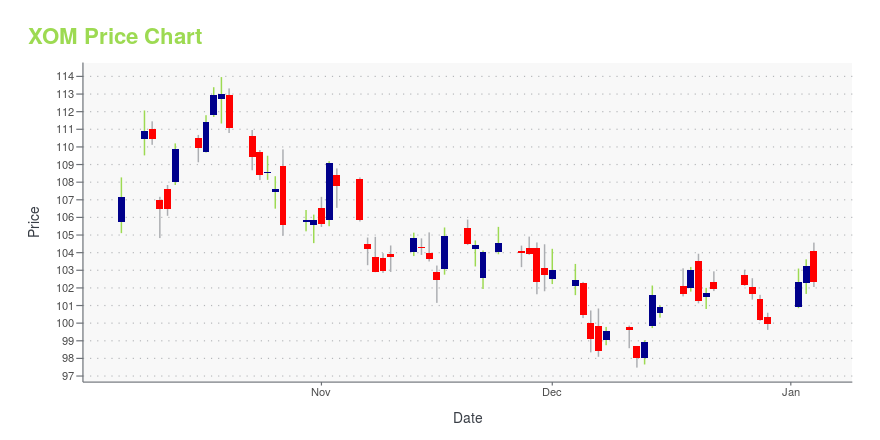
Exxon Mobil Corp. (XOM): Price and Financial Metrics
XOM Price/Volume Stats
Current price | $104.87 | 52-week high | $119.92 |
Prev. close | $103.36 | 52-week low | $80.69 |
Day low | $104.53 | Volume | 2,023,085 |
Day high | $105.31 | Avg. volume | 16,134,158 |
50-day MA | $110.14 | Dividend yield | 3.5% |
200-day MA | $106.82 | Market Cap | 423.99B |
XOM Stock Price Chart Interactive Chart >
XOM POWR Grades
- XOM scores best on the Momentum dimension, with a Momentum rank ahead of 98.2% of US stocks.
- XOM's strongest trending metric is Stability; it's been moving up over the last 179 days.
- XOM ranks lowest in Value; there it ranks in the 9th percentile.
XOM Stock Summary
- XOM has a market capitalization of $434,984,750,340 -- more than approximately 99.76% of US stocks.
- XOM's went public 37.42 years ago, making it older than 93.61% of listed US stocks we're tracking.
- Over the past twelve months, XOM has reported earnings growth of 133.5%, putting it ahead of 89.95% of US stocks in our set.
- Stocks with similar financial metrics, market capitalization, and price volatility to EXXON MOBIL CORP are UNH, WMT, V, JPM, and MA.
- XOM's SEC filings can be seen here. And to visit EXXON MOBIL CORP's official web site, go to corporate.exxonmobil.com.
XOM Valuation Summary
- XOM's price/sales ratio is 1; this is 28.57% lower than that of the median Energy stock.
- XOM's price/earnings ratio has moved down 7.5 over the prior 243 months.
Below are key valuation metrics over time for XOM.
Stock | Date | P/S | P/B | P/E | EV/EBIT |
---|---|---|---|---|---|
XOM | 2023-05-12 | 1.0 | 2.2 | 6.9 | 5.1 |
XOM | 2023-05-11 | 1.0 | 2.2 | 6.9 | 5.1 |
XOM | 2023-05-10 | 1.1 | 2.2 | 7.1 | 5.2 |
XOM | 2023-05-09 | 1.1 | 2.2 | 7.2 | 5.3 |
XOM | 2023-05-08 | 1.1 | 2.2 | 7.2 | 5.3 |
XOM | 2023-05-05 | 1.1 | 2.2 | 7.1 | 5.3 |
XOM Growth Metrics
- The 4 year price growth rate now stands at -46.81%.
- Its 5 year revenue growth rate is now at 6.98%.
- Its 2 year revenue growth rate is now at 23.12%.

The table below shows XOM's growth in key financial areas (numbers in millions of US dollars).
Date | Revenue | Operating Cash Flow | Net Income to Common Stock |
---|---|---|---|
2022-12-31 | 413,680 | 76,797 | 55,740 |
2022-09-30 | 403,216 | 76,300 | 51,860 |
2022-06-30 | 364,932 | 63,966 | 38,950 |
2022-03-31 | 316,993 | 53,653 | 25,790 |
2021-12-31 | 285,640 | 48,129 | 23,040 |
2021-09-30 | 247,215 | 35,010 | -5,900 |
XOM's Quality Factors
The “Quality” component of the POWR Ratings focuses on 31 different factors of a companies fundamentals and operational strength. Here are some key insights as we drill into the specifics of these quality attributes.- XOM has a Quality Grade of C, ranking ahead of 71.18% of graded US stocks.
- XOM's asset turnover comes in at 0.738 -- ranking 26th of 137 Petroleum and Natural Gas stocks.
- CVI, CLR, and PSX are the stocks whose asset turnover ratios are most correlated with XOM.
The table below shows XOM's key quality metrics over time.
Period | Asset Turnover | Gross Margin | ROIC |
---|---|---|---|
2021-09-30 | 0.738 | 0.342 | -0.018 |
2021-06-30 | 0.645 | 0.334 | -0.046 |
2021-03-31 | 0.532 | 0.347 | -0.067 |
2020-12-31 | 0.516 | 0.338 | -0.077 |
2020-09-30 | 0.562 | 0.347 | 0.015 |
2020-06-30 | 0.614 | 0.350 | 0.030 |
XOM Price Target
For more insight on analysts targets of XOM, see our XOM price target page. And for a list of of all stocks sorted by upside potential based on analyst target price, see our Top Price Target page.
Average Price Target | $66.20 | Average Broker Recommendation | 1.84 (Hold) |
Exxon Mobil Corp. (XOM) Company Bio
Exxon Mobil Corp. engages in the exploration and production of crude oil and natural gas. The company, as we know it today, was formed on November 30, 1999 with the merger of Exxon Corp. and Mobil Corp., creating one of the largest publicly traded international energy companies in the world. In addition to traditional energy operations, Exxon Mobil Chemical is a global chemical company specializing in converting crude oil into petrochemical feedstocks that are used in medical equipment, electronics, clothing, vitamin capsules, tires, and many other products. Exxon currently produces approximately 2.3 million barrels of oil equivalent energy per day.
Latest XOM News From Around the Web
Below are the latest news stories about EXXON MOBIL CORP that investors may wish to consider to help them evaluate XOM as an investment opportunity.
7 Safe-Haven Stocks to Buy for Protection From a U.S. Debt Default DisasterWith so many uncertainties about federal financial obligations, investors should target these safe-haven stocks for debt default. |
CVX Stock Alert: Chevron Acquires PDC Energy in $6.3 Billion DealAlthough Chevron’s acquisition of PDC Energy should be long-term accretive, CVX stock printed red ink over some lingering risks. |
These Stocks Are Moving the Most Today: Micron, PDC Energy, PacWest, Plug Power, DraftKings, and MoreChina bans companies from buying chips from Micron Technology, PDC Energy is being acquired by Chevron, PacWest sells off real estate loans, and Plug Power signs three deals for electrolyzer projects. |
Exxon Tiptoes Into the EV Future With Lithium DealExxon Mobil has bought land in Arkansas that contains lithium, a key component in lithium-ion batteries that power electric vehicles. |
EU Slaps Meta With Penalty For Data Privacy Violation, Uber's Diversity Leader Faces Heat, China Bans Some Of Micron's Product Sales: Today's Top StoriesBloomberg Meta Stock Falls Premarket: EU Slaps Company With Record $1.3B Penalty For Data Privacy Violation The Irish Data Protection Commission slapped Meta Platforms Inc (NASDAQ: META) with a penalty of a record €1.2 billion ($1.3 billion) for user privacy invasion. Meta has a deadline of five months to "suspend any future transfer of personal data to the U.S." and six months to stop "the unlawful processing, including storage, in the U.S." of transferred personal EU data, EU regulators in Dec |
XOM Price Returns
1-mo | -1.99% |
3-mo | -6.23% |
6-mo | -2.97% |
1-year | 11.08% |
3-year | 159.67% |
5-year | 66.02% |
YTD | -3.36% |
2022 | 87.41% |
2021 | 57.58% |
2020 | -36.21% |
2019 | 7.23% |
2018 | -15.09% |
XOM Dividends
Ex-Dividend Date | Type | Payout Amount | Change | ||||||
---|---|---|---|---|---|---|---|---|---|
Loading, please wait... |
Continue Researching XOM
Here are a few links from around the web to help you further your research on Exxon Mobil Corp's stock as an investment opportunity:Exxon Mobil Corp (XOM) Stock Price | Nasdaq
Exxon Mobil Corp (XOM) Stock Quote, History and News - Yahoo Finance
Exxon Mobil Corp (XOM) Stock Price and Basic Information | MarketWatch
Loading social stream, please wait...