Xperi Inc (XPER): Price and Financial Metrics
XPER Price/Volume Stats
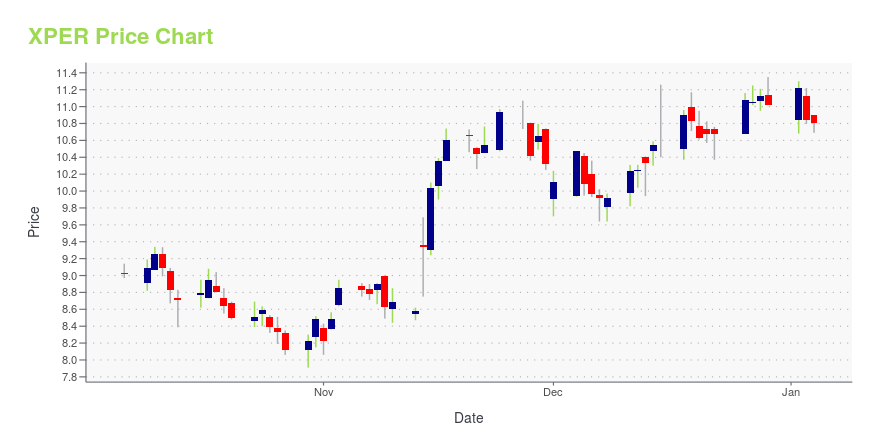
Current price | $12.06 | 52-week high | $13.62 |
Prev. close | $11.52 | 52-week low | $7.91 |
Day low | $11.45 | Volume | 728,100 |
Day high | $12.13 | Avg. volume | 446,110 |
50-day MA | $10.99 | Dividend yield | N/A |
200-day MA | $10.96 | Market Cap | 543.06M |
XPER Stock Price Chart Interactive Chart >
XPER POWR Grades
- XPER scores best on the Growth dimension, with a Growth rank ahead of 85.31% of US stocks.
- The strongest trend for XPER is in Sentiment, which has been heading down over the past 166 days.
- XPER's current lowest rank is in the Momentum metric (where it is better than 11.72% of US stocks).
XPER Stock Summary
- With a one year PEG ratio of 0.77, XPERI INC is expected to have a higher PEG ratio (a measure of how expensive a stock is relative to its expected earnings growth) than only 7.01% of US stocks.
- XPERI INC's stock had its IPO on October 3, 2022, making it an older stock than just 0.47% of US equities in our set.
- Of note is the ratio of XPERI INC's sales and general administrative expense to its total operating expenses; only 12.79% of US stocks have a lower such ratio.
- Stocks that are quantitatively similar to XPER, based on their financial statements, market capitalization, and price volatility, are STRC, FNCH, VRAR, FF, and OUST.
- XPER's SEC filings can be seen here. And to visit XPERI INC's official web site, go to xperi.com.
XPER Valuation Summary
- XPER's EV/EBIT ratio is -1; this is 104.72% lower than that of the median Technology stock.
- XPER's EV/EBIT ratio has moved up 2.5 over the prior 14 months.
Below are key valuation metrics over time for XPER.
Stock | Date | P/S | P/B | P/E | EV/EBIT |
---|---|---|---|---|---|
XPER | 2023-12-08 | 0.8 | 1.1 | -1.1 | -1 |
XPER | 2023-12-07 | 0.8 | 1.1 | -1.1 | -1 |
XPER | 2023-12-06 | 0.8 | 1.1 | -1.1 | -1 |
XPER | 2023-12-05 | 0.8 | 1.1 | -1.1 | -1 |
XPER | 2023-12-04 | 0.9 | 1.1 | -1.1 | -1 |
XPER | 2023-12-01 | 0.8 | 1.1 | -1.1 | -1 |
XPER Growth Metrics
- Its 5 year cash and equivalents growth rate is now at 115.09%.
- The year over year price growth rate now stands at -21.77%.
- Its year over year cash and equivalents growth rate is now at 58.87%.
The table below shows XPER's growth in key financial areas (numbers in millions of US dollars).
Date | Revenue | Operating Cash Flow | Net Income to Common Stock |
---|---|---|---|
2022-06-30 | 925.266 | 238.843 | -40.308 |
2022-03-31 | 913.52 | 254.333 | -35.801 |
2021-12-31 | 877.696 | 234.789 | -55.457 |
2021-09-30 | 1,097.174 | 464.083 | 138.893 |
2021-06-30 | 1,080.592 | 443.34 | 154.208 |
2021-03-31 | 995.951 | 421.688 | 132.713 |
XPER's Quality Factors
The “Quality” component of the POWR Ratings focuses on 31 different factors of a companies fundamentals and operational strength. Here are some key insights as we drill into the specifics of these quality attributes.- XPER has a Quality Grade of B, ranking ahead of 79.34% of graded US stocks.
- XPER's asset turnover comes in at 0.408 -- ranking 158th of 208 Electronic Equipment stocks.
- EMAN, SMTC, and KVHI are the stocks whose asset turnover ratios are most correlated with XPER.
The table below shows XPER's key quality metrics over time.
Period | Asset Turnover | Gross Margin | ROIC |
---|---|---|---|
2021-06-30 | 0.408 | 0.887 | 0.137 |
2021-03-31 | 0.370 | 0.895 | 0.112 |
2020-12-31 | 0.389 | 0.912 | 0.138 |
2020-09-30 | 0.292 | 0.913 | -0.016 |
2020-06-30 | 0.274 | 0.963 | -0.030 |
2020-03-31 | 0.324 | 0.977 | -0.008 |
XPER Price Target
For more insight on analysts targets of XPER, see our XPER price target page. And for a list of of all stocks sorted by upside potential based on analyst target price, see our Top Price Target page.
Average Price Target | $28.00 | Average Broker Recommendation | 1.5 (Moderate Buy) |
Xperi Inc (XPER) Company Bio
Xperi Inc invents, develops, and delivers technologies that enable experiences. In the home, in the car, and on the go, it manages content and connections. Its offering comprises a portfolio of software and services. Its business is divided into four categories based on the products delivered and customers served: Pay-TV, Consumer Electronics, Connected Car, and Platform Solutions. The company was incorporated in 2019 and is headquartered in San Jose, California.
Latest XPER News From Around the Web
Below are the latest news stories about XPERI INC that investors may wish to consider to help them evaluate XPER as an investment opportunity.
13 Most Promising Tech Stocks According to AnalystsIn this piece, we will take a look at the 13 most promising tech stocks according to analysts. If you want to skip our coverage of the latest developments in the technology industry, then you can skip the introduction and take a look at the 5 Most Promising Tech Stocks According to Analysts. The technology […] |
Xperi Inc. Announces Definitive Agreement to Sell its AutoSense and Imaging Business to Tobii ABSAN JOSE, Calif., December 12, 2023--Xperi Inc. (NYSE: XPER) (the "Company" or "Xperi"), an entertainment technology company that invents, develops, and delivers technologies that enable extraordinary experiences, today announced it has entered into a definitive agreement to sell its AutoSense in-cabin safety business and related imaging solutions to Tobii AB, an eye tracking and attention computing company based in Sweden listed on the Stockholm Nasdaq exchange. |
Xperi Inc.'s (NYSE:XPER) Business And Shares Still Trailing The IndustryYou may think that with a price-to-sales (or "P/S") ratio of 0.8x Xperi Inc. ( NYSE:XPER ) is definitely a stock worth... |
Xperi Holding Corporation (NASDAQ:XPER) Q3 2023 Earnings Call TranscriptXperi Holding Corporation (NASDAQ:XPER) Q3 2023 Earnings Call Transcript November 13, 2023 Xperi Holding Corporation misses on earnings expectations. Reported EPS is $-0.08 EPS, expectations were $-0.06. Operator: Good day, everyone. Thank you for standing by. Welcome to the Xperi Third Quarter 2023 Earnings Conference Call. During today’s presentation all parties will be in a […] |
Q3 2023 Xperi Inc Earnings CallQ3 2023 Xperi Inc Earnings Call |
XPER Price Returns
1-mo | 7.20% |
3-mo | 9.44% |
6-mo | 22.31% |
1-year | 13.13% |
3-year | N/A |
5-year | N/A |
YTD | 9.44% |
2023 | 27.99% |
2022 | N/A |
2021 | N/A |
2020 | N/A |
2019 | N/A |
Continue Researching XPER
Want to do more research on Xperi Corp's stock and its price? Try the links below:Xperi Corp (XPER) Stock Price | Nasdaq
Xperi Corp (XPER) Stock Quote, History and News - Yahoo Finance
Xperi Corp (XPER) Stock Price and Basic Information | MarketWatch
Loading social stream, please wait...