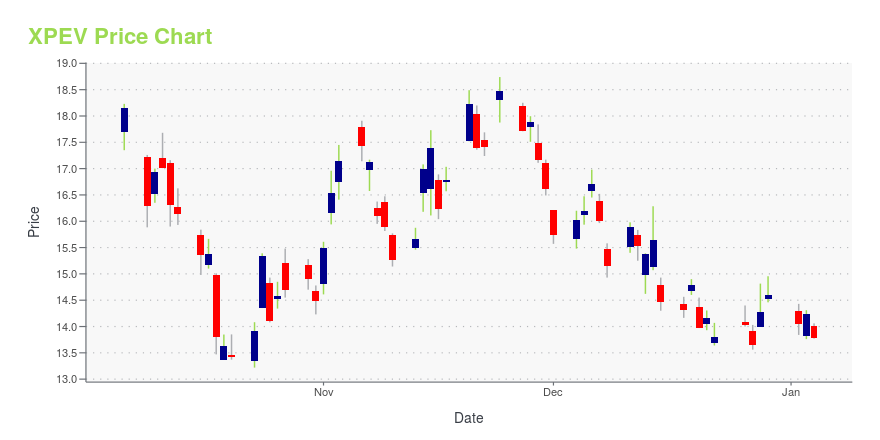
XPeng Inc. ADR (XPEV): Price and Financial Metrics
XPEV Price/Volume Stats
| Current price | $8.51 | 52-week high | $23.62 |
| Prev. close | $8.20 | 52-week low | $6.55 |
| Day low | $8.15 | Volume | 11,778,600 |
| Day high | $8.78 | Avg. volume | 13,445,733 |
| 50-day MA | $8.10 | Dividend yield | N/A |
| 200-day MA | $10.71 | Market Cap | 8.02B |
XPEV Stock Price Chart Interactive Chart >
XPeng Inc. ADR (XPEV) Company Bio
Guangzhou Xiaopeng Motors Technology Co Ltd (Chinese: 广州小鹏汽车科技有限公司; pinyin: Guǎngzhōu Xiǎopéng Qìchē Kējì Yǒuxiàn Gōngsī), doing business as XPeng Motors (Chinese: 小鹏汽车; pinyin: Xiǎopéng Qìchē), commonly known as XPeng, is a Chinese electric vehicle manufacturer. The company is headquartered in Guangzhou, Guangdong, with offices in Mountain View, California, United States and is publicly traded on the New York Stock Exchange. (Source:Wikipedia)
Latest XPEV News From Around the Web
Below are the latest news stories about XPENG INC that investors may wish to consider to help them evaluate XPEV as an investment opportunity.
Good News! Why Top China EV Play Li Auto Is Just Getting Started.For long-term investors bullish on the rise of EVs in China, LI stock remains a standout choice among U.S.-listed names in the space. |
Tesla Forecast: Why 2024 Will Be Decisive for TSLA StockEntering 2024, TSLA stock ride the wave as the company chases global domination, but Elon Musk could be on the edge of total collapse. |
China EV Registrations Show Race To Finish For Li Auto, Nio, XPeng, BYDChina EV registrations ramped up for Li Auto, BYD and Nio last week, as the Tesla rivals race to hit year-end targets. |
Down 80%, Is XPENG Stock a Buy for 2024?The electric vehicle industry should grow substantially over the next two decades. |
3 Contrarian Stock Plays for Bold Investors in 2024The rebound of stocks this year, despite the huge skepticism of much of the Street, showed how profitable contrarian stocks can be. |
XPEV Price Returns
| 1-mo | 3.28% |
| 3-mo | 8.55% |
| 6-mo | -5.13% |
| 1-year | -57.91% |
| 3-year | -75.48% |
| 5-year | N/A |
| YTD | -41.67% |
| 2023 | 46.78% |
| 2022 | -80.25% |
| 2021 | 17.51% |
| 2020 | N/A |
| 2019 | N/A |


Loading social stream, please wait...