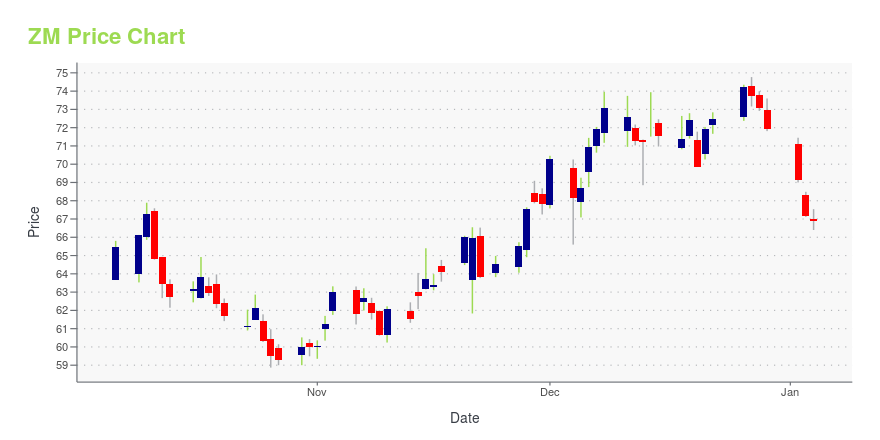
Zoom Video Communications, Inc. - (ZM): Price and Financial Metrics
GET POWR RATINGS... FREE!
ZM POWR Grades
- Quality is the dimension where ZM ranks best; there it ranks ahead of 90.41% of US stocks.
- The strongest trend for ZM is in Quality, which has been heading down over the past 179 days.
- ZM ranks lowest in Stability; there it ranks in the 16th percentile.
ZM Stock Summary
- Zoom Video Communications Inc's market capitalization of $37,767,391,568 is ahead of 92.63% of US-listed equities.
- ZM's went public 2.95 years ago, making it older than merely 9.07% of listed US stocks we're tracking.
- The volatility of Zoom Video Communications Inc's share price is greater than that of 92.27% US stocks with at least 200 days of trading history.
- Stocks with similar financial metrics, market capitalization, and price volatility to Zoom Video Communications Inc are RNG, DOCU, PLAN, GDRX, and BILL.
- ZM's SEC filings can be seen here. And to visit Zoom Video Communications Inc's official web site, go to www.zoom.us.
ZM Valuation Summary
- In comparison to the median Communication Services stock, ZM's price/earnings ratio is 481.58% higher, now standing at 88.4.
- ZM's price/earnings ratio has moved NA NA over the prior 29 months.
- ZM's EV/EBIT ratio has moved down 1811.9 over the prior 29 months.
Below are key valuation metrics over time for ZM.
Stock | Date | P/S | P/B | P/E | EV/EBIT |
---|---|---|---|---|---|
ZM | 2021-09-03 | 24.4 | 19.0 | 88.4 | 85.8 |
ZM | 2021-09-02 | 24.1 | 18.8 | 87.4 | 84.9 |
ZM | 2021-09-01 | 23.8 | 18.6 | 86.2 | 83.6 |
ZM | 2021-08-31 | 23.6 | 18.5 | 85.8 | 83.2 |
ZM | 2021-08-30 | 31.2 | 24.4 | 117.4 | 115.0 |
ZM | 2021-08-27 | 30.6 | 24.0 | 115.2 | 112.7 |
ZM's Quality Factors
The “Quality” component of the POWR Ratings focuses on 31 different factors of a companies fundamentals and operational strength. Here are some key insights as we drill into the specifics of these quality attributes.- ZM has a Quality Grade of A, ranking ahead of 95.62% of graded US stocks.
- ZM's asset turnover comes in at 0.701 -- ranking 221st of 561 Business Services stocks.
- 500 - Internal server error
The table below shows ZM's key quality metrics over time.
Period | Asset Turnover | Gross Margin | ROIC |
---|---|---|---|
2021-07-31 | 0.701 | 0.711 | 0.469 |
2021-04-30 | 0.778 | 0.700 | 0.557 |
2021-01-31 | 0.813 | 0.690 | 0.671 |
2020-10-31 | 0.867 | 0.700 | 0.587 |
2020-07-31 | 0.751 | 0.733 | 0.355 |
2020-04-30 | 0.590 | 0.765 | 0.078 |
ZM Price Target
For more insight on analysts targets of ZM, see our ZM price target page. And for a list of of all stocks sorted by upside potential based on analyst target price, see our Top Price Target page.
Average Price Target | $388.00 | Average Broker Recommendation | 1.61 (Moderate Buy) |
ZM Stock Price Chart Interactive Chart >
ZM Price/Volume Stats
Current price | $110.97 | 52-week high | $406.48 |
Prev. close | $107.97 | 52-week low | $79.03 |
Day low | $106.83 | Volume | 2,800,200 |
Day high | $111.98 | Avg. volume | 5,067,104 |
50-day MA | $103.65 | Dividend yield | N/A |
200-day MA | $165.68 | Market Cap | 33.11B |
Zoom Video Communications, Inc. - (ZM) Company Bio
Founded in 2011, Zoom Video Communications, Inc. develops a people-centric cloud service that transforms real-time collaboration experience. The company offers unified meeting experience, a cloud service that provides a 3-in-1 meeting platform with HD video conferencing, mobility, and web meetings. Zoom Video Communications serves customers worldwide. Headquartered in San Diego, California, Zoom has office locations around the world, including the U.S., Europe, Asia, and Australia. Zoom’s current customer base spans numerous industry categories, including education, entertainment/media, enterprise infrastructure, finance, government, health care, manufacturing, non-profit/not for profit and social impact, retail/consumer products, and software/internet. As of 2021, the company has over 450,000 customers with more than 10 employees. Eric Yuan currently serves as the company’s Chief Executive Officer.
Latest ZM News From Around the Web
Below are the latest news stories about Zoom Video Communications Inc that investors may wish to consider to help them evaluate ZM as an investment opportunity.
Will Zoom Video Communications' Q4 Earnings slowing growth take the stock lower presenting Buy opportunity?Zoom Video Communications (NASDAQ:ZM) is scheduled to announce Q4 earnings results on Monday, February 28th, after market close. The consensus EPS Estimate is $1.07 (-12.3% Y/Y) and the consensus Revenue Estimate is $1.05B (+19.0% Y/Y). Over the last 2 years, ZM has beaten EPS estimates 100% of the time and... |
7 Stocks Reporting Earnings the Week Of February 28Earnings season is winding down. |
Is Now The Time To Buy Stock In Novavax, Zoom Or Workhorse?Analysts and brokerage firms often use ratings when they issue stock recommendations to stock traders. Analysts arrive at stock ratings by researching public financial statements, communicating with executives and customers and following industry trends. Here are the latest analyst rating updates for Novavax, Inc. (NASDAQ: NVAX ), Zoom Video Communications Inc (NASDAQ: ZM ) and Workhorse Group Inc (NASDAQ: WKHS ): The latest price target for Novavax was by Cowen & Co. on Jan. 21. The analyst firm set a price target of $150, a possible 104.11% upside. Seven analyst firms have reported ratings in the … Full story available on Benzinga.com |
Will Zoom Video Communications'' Q4 Earnings slowing growth take the stock lower presenting Buy opportunity?Zoom Video Communications (NASDAQ:ZM) is scheduled to announce Q4 earnings results on Monday, February 28th, after market close.The consensus EPS Estimate is $1.07 (-12.3% Y/Y) and… |
Is Zoom Stock A Buy? Bears Fret Over Microsoft Teams EssentialsYes, shares in Zoom Video soared during the coronavirus crisis. But what's the outlook for Zoom stock after the Five9 merger failed to close? |
ZM Price Returns
1-mo | 1.42% |
3-mo | -10.71% |
6-mo | -38.30% |
1-year | -71.46% |
3-year | 22.69% |
5-year | N/A |
YTD | -39.66% |
2021 | -45.48% |
2020 | 395.77% |
2019 | N/A |
2018 | N/A |
2017 | N/A |
Loading social stream, please wait...