
Zevia PBC (ZVIA): Price and Financial Metrics
ZVIA Price/Volume Stats
| Current price | $0.82 | 52-week high | $4.80 |
| Prev. close | $0.83 | 52-week low | $0.80 |
| Day low | $0.81 | Volume | 86,700 |
| Day high | $0.89 | Avg. volume | 153,239 |
| 50-day MA | $1.23 | Dividend yield | N/A |
| 200-day MA | $2.00 | Market Cap | 58.87M |
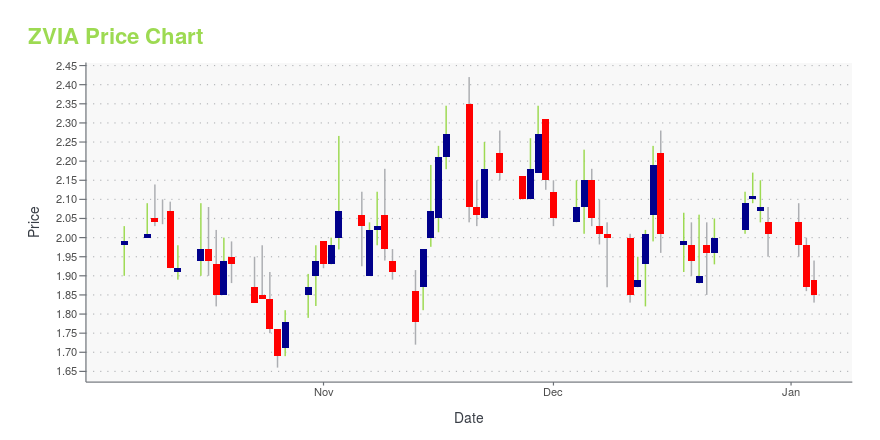
ZVIA Stock Price Chart Interactive Chart >
Zevia PBC (ZVIA) Company Bio
Zevia PBC, a beverage company, develops, markets, sells, and distributes various zero calorie carbonated soft drinks under the Zevia brand name in the United States and Canada. It offers soda, energy drinks, non-alcoholic mixers, organic tea, kidz drinks, and flavored sparkling water. The company offers its products through various retail channels, including grocery stores, natural products stores, warehouse stores, and specialty outlets, as well as e-commerce channels. Zevia PBC was founded in 2007 and is based in Encino, California.
Latest ZVIA News From Around the Web
Below are the latest news stories about ZEVIA PBC that investors may wish to consider to help them evaluate ZVIA as an investment opportunity.
Zevia to Participate in the 26th Annual ICR ConferenceLOS ANGELES, December 27, 2023--Zevia PBC ("Zevia" or the "Company") (NYSE: ZVIA), the company disrupting the liquid refreshment beverage industry with great tasting, zero sugar beverages made with simple, plant-based ingredients, today announced its participation in the 26th Annual ICR Conference to be held January 8-10, 2024 in Orlando, FL. |
Zevia PBC (NYSE:ZVIA) is favoured by institutional owners who hold 71% of the companyKey Insights Given the large stake in the stock by institutions, Zevia PBC's stock price might be vulnerable to their... |
Zevia PBC (NYSE:ZVIA) Q3 2023 Earnings Call TranscriptZevia PBC (NYSE:ZVIA) Q3 2023 Earnings Call Transcript November 13, 2023 Operator: Greetings and welcome to Zevia PBC Q3 2023 earnings call. [Operator Instructions] It is now my pleasure to introduce your host Reed Anderson, Managing Director ICR. Thank you Mr. Anderson. You may begin. Reed Anderson: Thank you, and welcome to Zevia’s third quarter […] |
Sentiment Still Eluding Zevia PBC (NYSE:ZVIA)With a price-to-sales (or "P/S") ratio of 0.6x Zevia PBC ( NYSE:ZVIA ) may be sending bullish signals at the moment... |
Zevia PBC (ZVIA) Reports Q3 2023 Earnings: Gross Margin Up 2.1% YoY Despite Net Sales DecreaseNet Sales Decrease by 2.6% YoY, Gross Profit Margin Increases to 45.4% |
ZVIA Price Returns
| 1-mo | -21.90% |
| 3-mo | -47.77% |
| 6-mo | -53.93% |
| 1-year | -75.52% |
| 3-year | N/A |
| 5-year | N/A |
| YTD | -59.20% |
| 2023 | -50.86% |
| 2022 | -41.99% |
| 2021 | N/A |
| 2020 | N/A |
| 2019 | N/A |
Loading social stream, please wait...